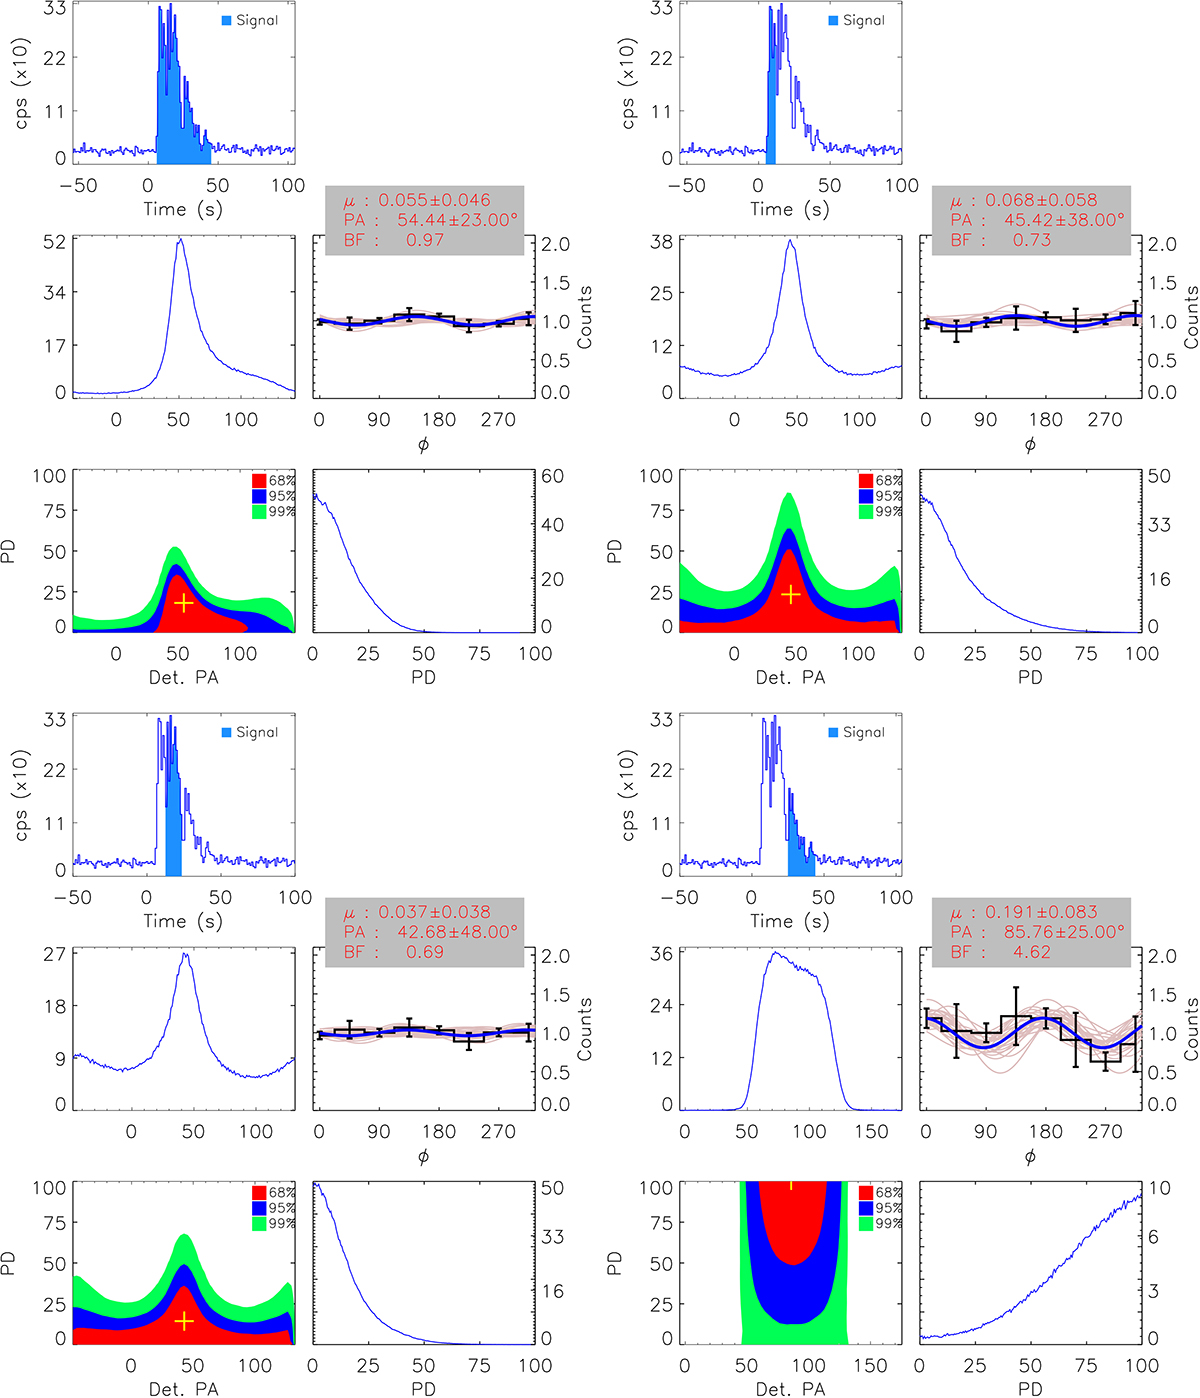
Fig. A.1.
Download original image
Time-integrated (top-left figure) and time-resolved (top-right figure for Region 1, bottom-left figure for Region 2, and bottom-right figure for Region 3) polarization analysis of GRB 230307A in 100-600 keV using AstroSat CZTI. Each figure is composed of five panels: (1) the Compton light curve for the Region of interest (time-integrated, Region 1, Region 2, and Region 3), obtained using Bayesian block analysis (blue-shaded Region, top panel); (2) the posterior probability distribution of the detector PA (middle-left panel); (3) the modulation curve of the burst, illustrating the azimuthal dependence of the detected counts (middle-right panel) where in blue is the best fit curve and pink are the 250 randomly selected fitted modulation curves; (4) a two-dimensional contour plot depicting the joint posterior distribution of the detector PA and PF (denoted as PD in the plots, equivalent to the PF referenced in the text; bottom-left panel); and (5) the posterior probability distribution of the PF (bottom-right panel). The Bayes factor, quantifying the strength of evidence for polarization, is computed for the 100–600 keV energy range.
Current usage metrics show cumulative count of Article Views (full-text article views including HTML views, PDF and ePub downloads, according to the available data) and Abstracts Views on Vision4Press platform.
Data correspond to usage on the plateform after 2015. The current usage metrics is available 48-96 hours after online publication and is updated daily on week days.
Initial download of the metrics may take a while.