Fig. 1.
Download original image
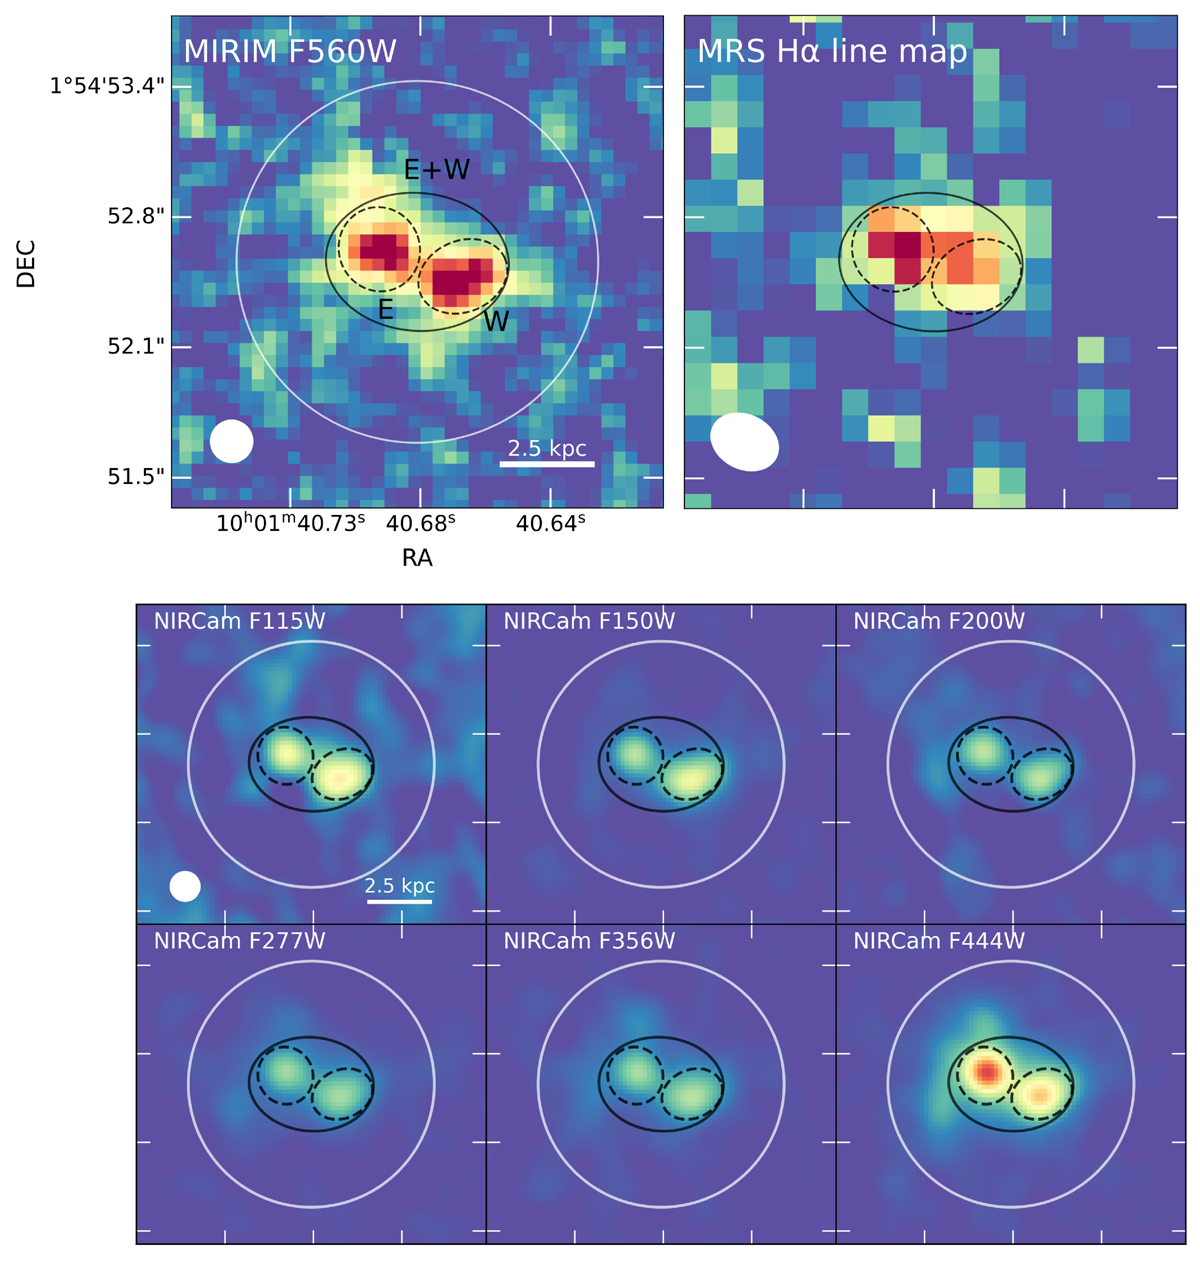
Top left: MIRI Image F560W. The white circumference represents a 0.9″ radius aperture. The solid black elliptical line represents the E+W galaxies’ apertures for the Hα emission of the whole galaxy; the dashed black lines represent the apertures for galaxies E and W. The white filled circle area in the bottom left represents the spatial resolution (PSF FWHM) of the MIRI image F560W. Top right: Hα line map. The Hα line map is generated by integrating Hα line emission in the velocity range: –500 < v [km s−1] < 300. The white filled area represents the spatial resolution (PSF FWHM) of the MRS. Bottom: NIRCam cutouts in six filters, F115W to F444W (left to right and top to bottom). The images are homogenized to the PSF of the MIRI image, represented with the white filled circle in the NIRCam F115W image.
Current usage metrics show cumulative count of Article Views (full-text article views including HTML views, PDF and ePub downloads, according to the available data) and Abstracts Views on Vision4Press platform.
Data correspond to usage on the plateform after 2015. The current usage metrics is available 48-96 hours after online publication and is updated daily on week days.
Initial download of the metrics may take a while.