Fig. 2.
Download original image
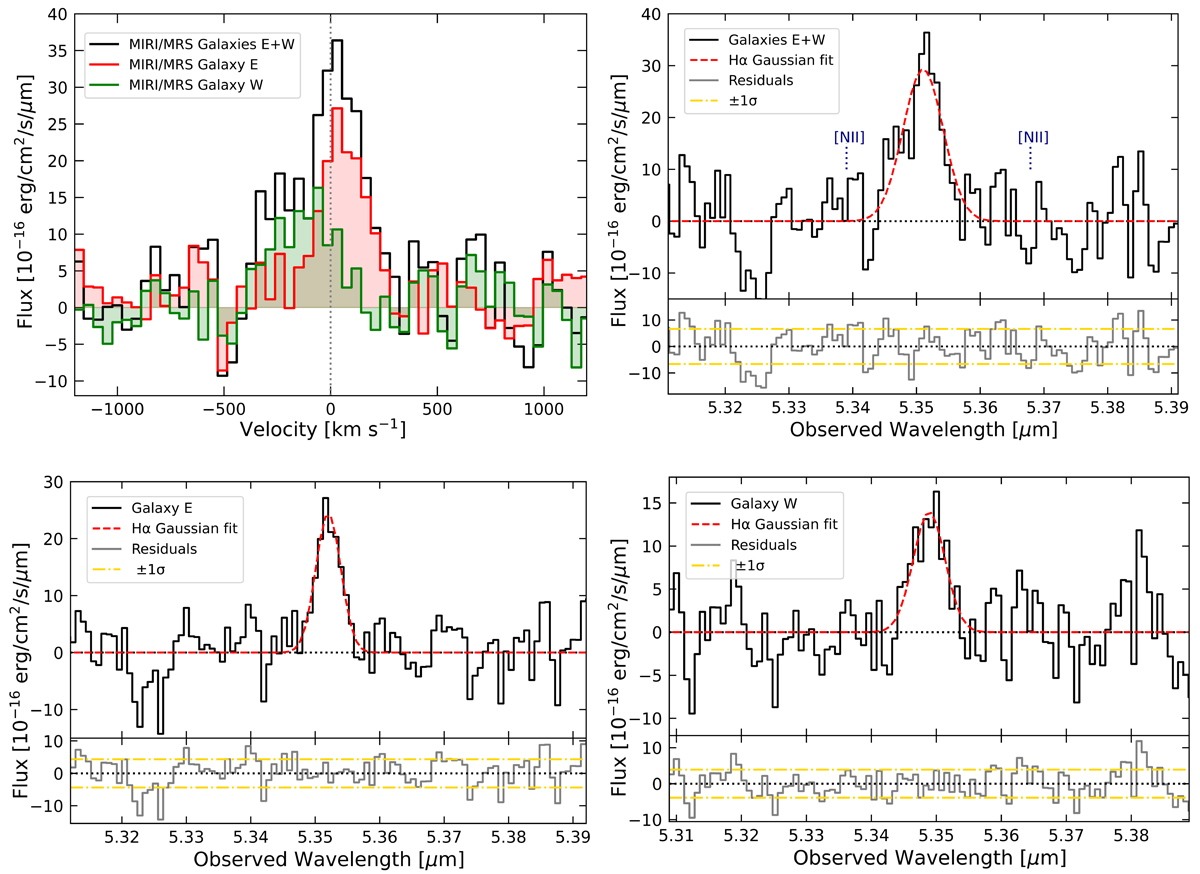
MIRI MRS 1 SHORT spectra for Hα observed at z = 7.1513. Top left: Hα spectra shown in velocity space for two spatially separated galaxies, E and W (red line and green line, respectively), identified in the Hα line map. The black line shows the integrated MRS spectrum of B14-65666 extracted using the galaxies E+W aperture. Top right: E+W galaxies’ integrated Hα spectrum. A vertical dashed line shows the wavelength of the weaker undetected lines [N II] 6550 Å and [N II] 6585 Å that are well separated in wavelength from Hα 6563 AA. Bottom left: Galaxy E’s integrated Hα spectrum. Bottom right: Galaxy W’s integrated Hα spectrum. The red dashed line shows the single Gaussian fits, with the residuals shown in the bottom panels. 1σ noise level is shown in yellow; it was calculated from the continuum adjacent to the emission line.
Current usage metrics show cumulative count of Article Views (full-text article views including HTML views, PDF and ePub downloads, according to the available data) and Abstracts Views on Vision4Press platform.
Data correspond to usage on the plateform after 2015. The current usage metrics is available 48-96 hours after online publication and is updated daily on week days.
Initial download of the metrics may take a while.