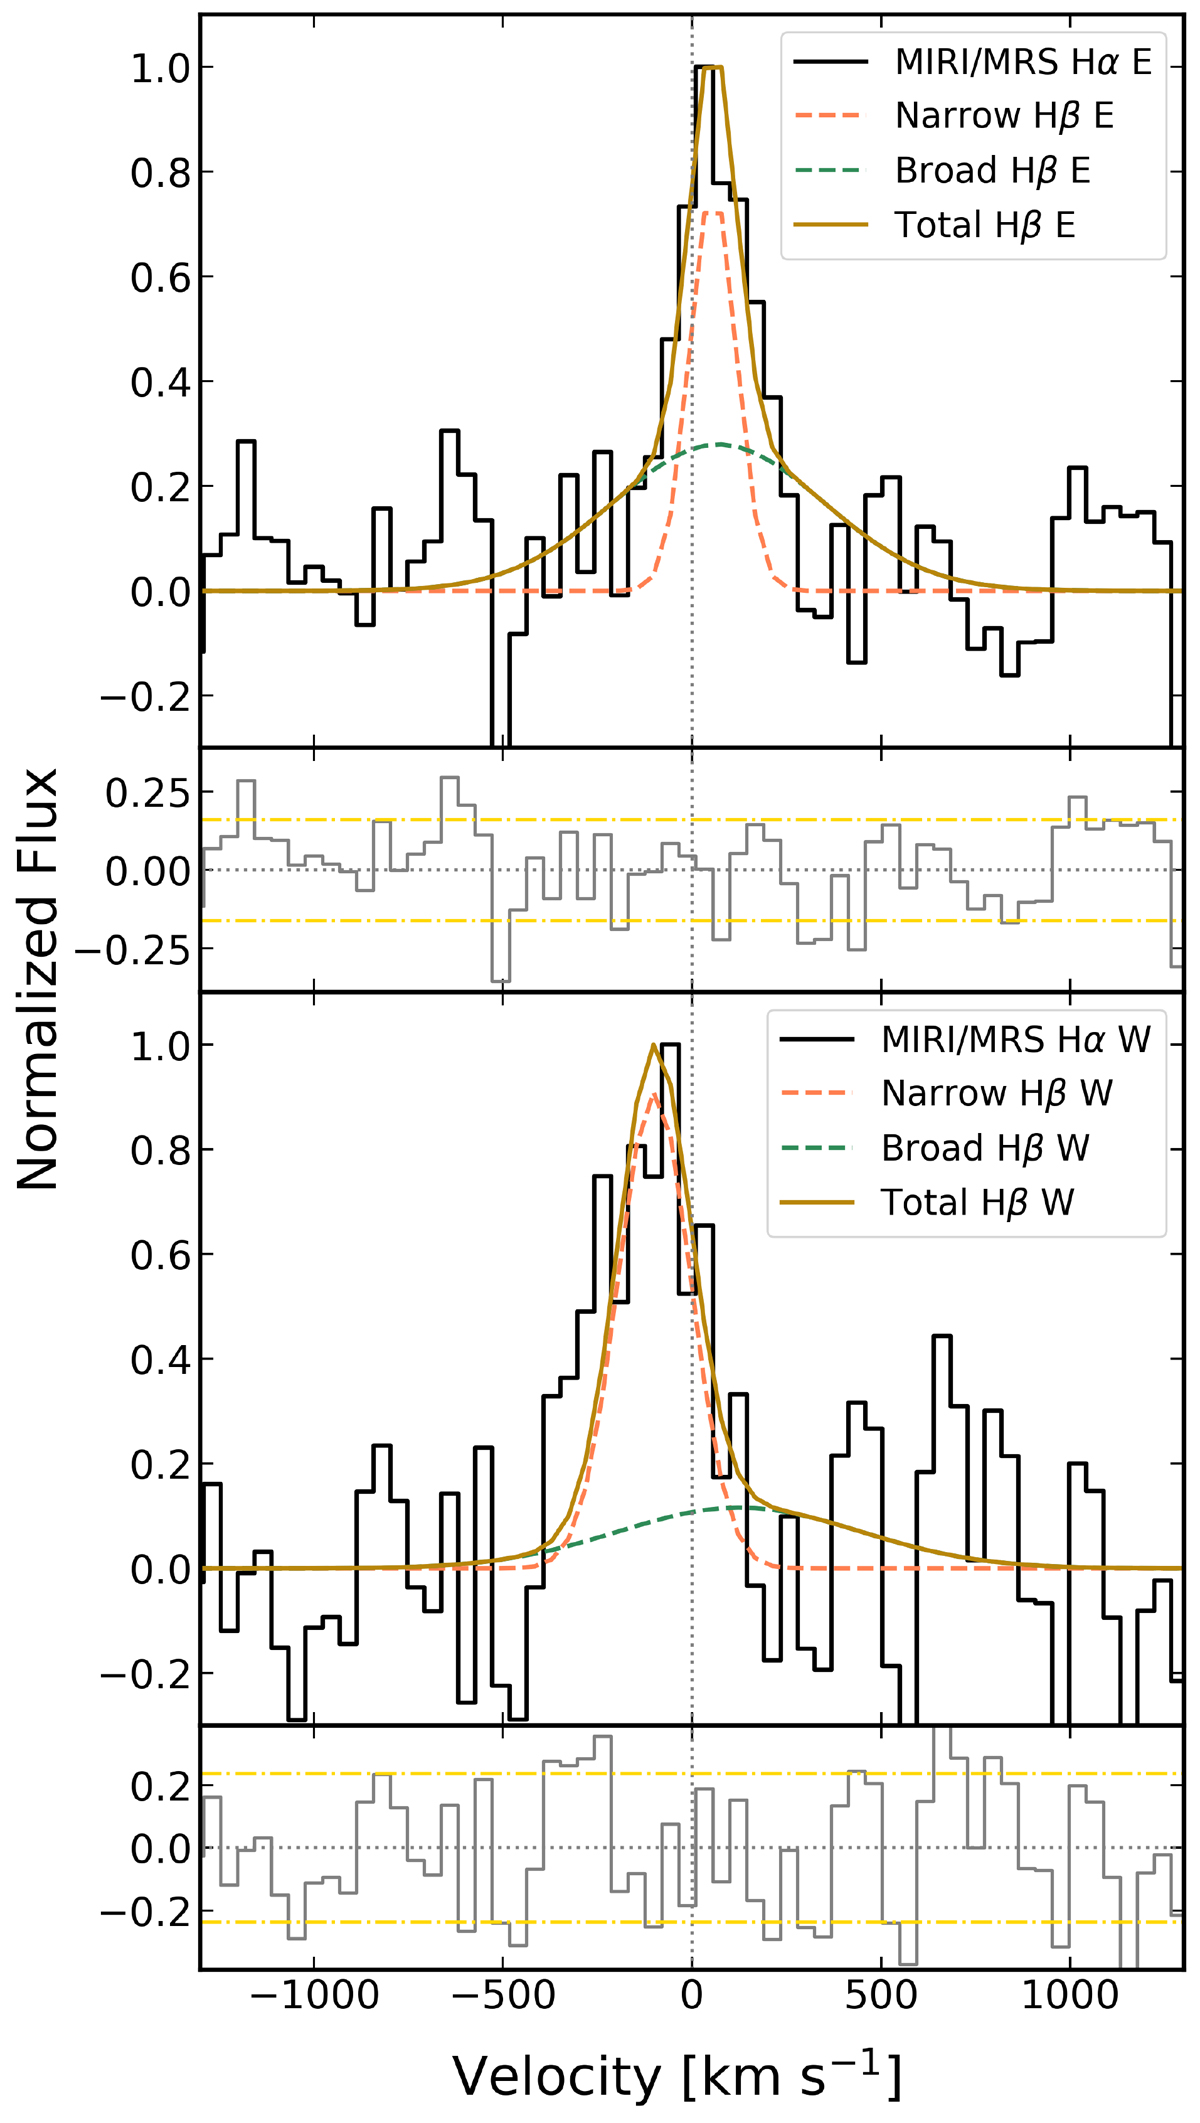
Fig. 7.
Download original image
Direct comparison of MRS-observed Hα emission-line profile for galaxies E (top) and W (bottom), with the rescaled Hβ narrow- and broad-line components identified in lower spectral resolution NIRSpec IFS (Jones et al. 2024). The presence of the narrow plus broad components could be compatible with the observed Hα line profile (see Sect. 4.5 for a detailed discussion). The systemic velocity corresponds to redshift 7.1513. The residuals are shown in the bottom plots, together with the 1σ noise level (yellow).
Current usage metrics show cumulative count of Article Views (full-text article views including HTML views, PDF and ePub downloads, according to the available data) and Abstracts Views on Vision4Press platform.
Data correspond to usage on the plateform after 2015. The current usage metrics is available 48-96 hours after online publication and is updated daily on week days.
Initial download of the metrics may take a while.