Fig. 8.
Download original image
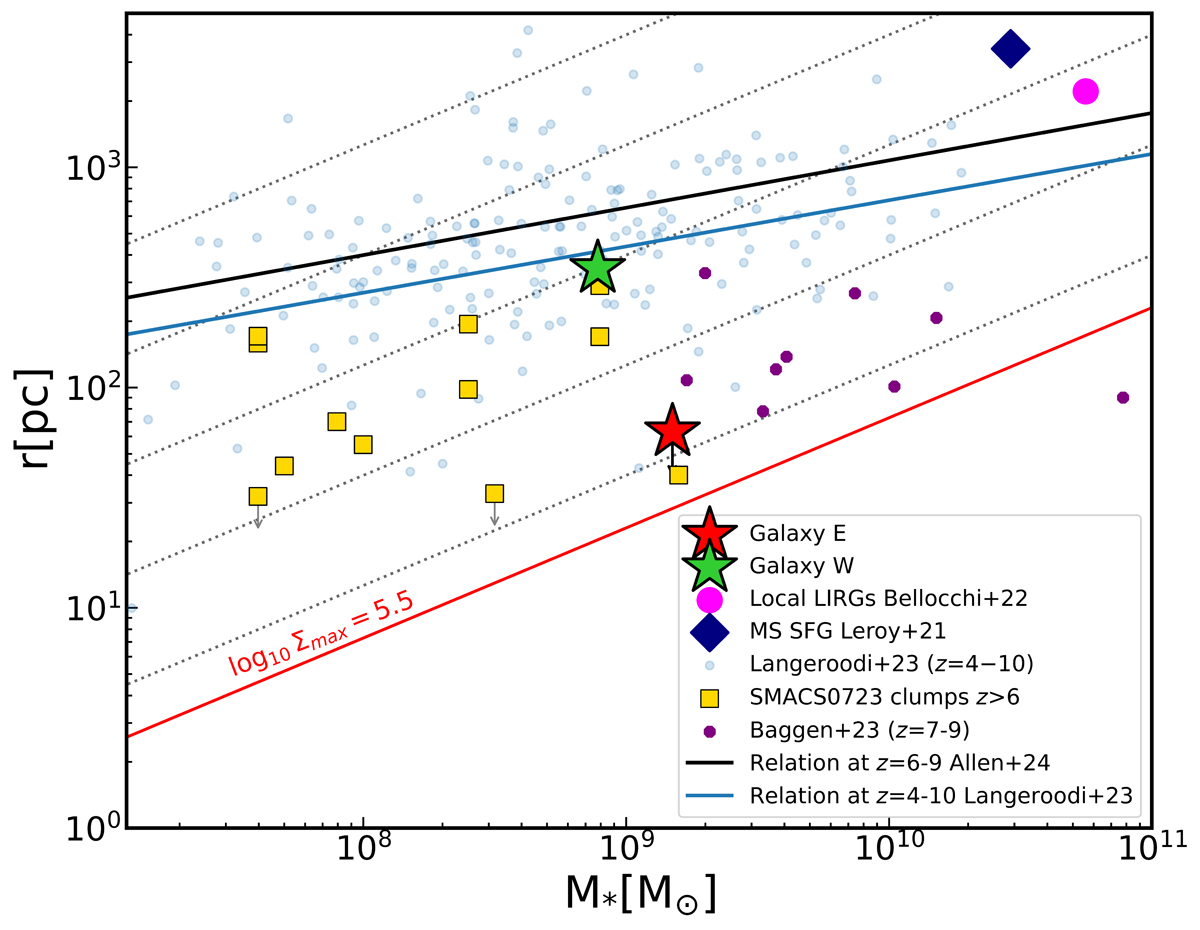
Mass-size relation for galaxies E (red star) and W (green star) in B14-65666, together with clumps of SMACS0723 at redshifts 6.4–8.5 (yellow squares, Claeyssens et al. 2023) and a subsample of massive and compact galaxies from the CEERS program (purple circles, Baggen et al. 2023). The blue line represents the mass-size relation for galaxies (blue dots) at redshifts 4–10 (Langeroodi & Hjorth 2023), while the solid black line indicates the mass-size relation for redshifts 6–9 derived for the NIRCam filter F150W (Allen et al. 2025). As B14-65666 is an interacting system, we also represent the mean values of the mass and size for local LIRGs and MS SFGs (Bellocchi et al. 2022) and (Leroy et al. 2021). Dotted gray lines represent constant stellar mass surface density for 10, 102, 103, 104, and 105 M⊙ pc−2. The red line indicates the observed maximum value of stellar-mass surface density in clusters and nuclei of galaxies, 105.5 M⊙ pc−2.
Current usage metrics show cumulative count of Article Views (full-text article views including HTML views, PDF and ePub downloads, according to the available data) and Abstracts Views on Vision4Press platform.
Data correspond to usage on the plateform after 2015. The current usage metrics is available 48-96 hours after online publication and is updated daily on week days.
Initial download of the metrics may take a while.