Fig. 9.
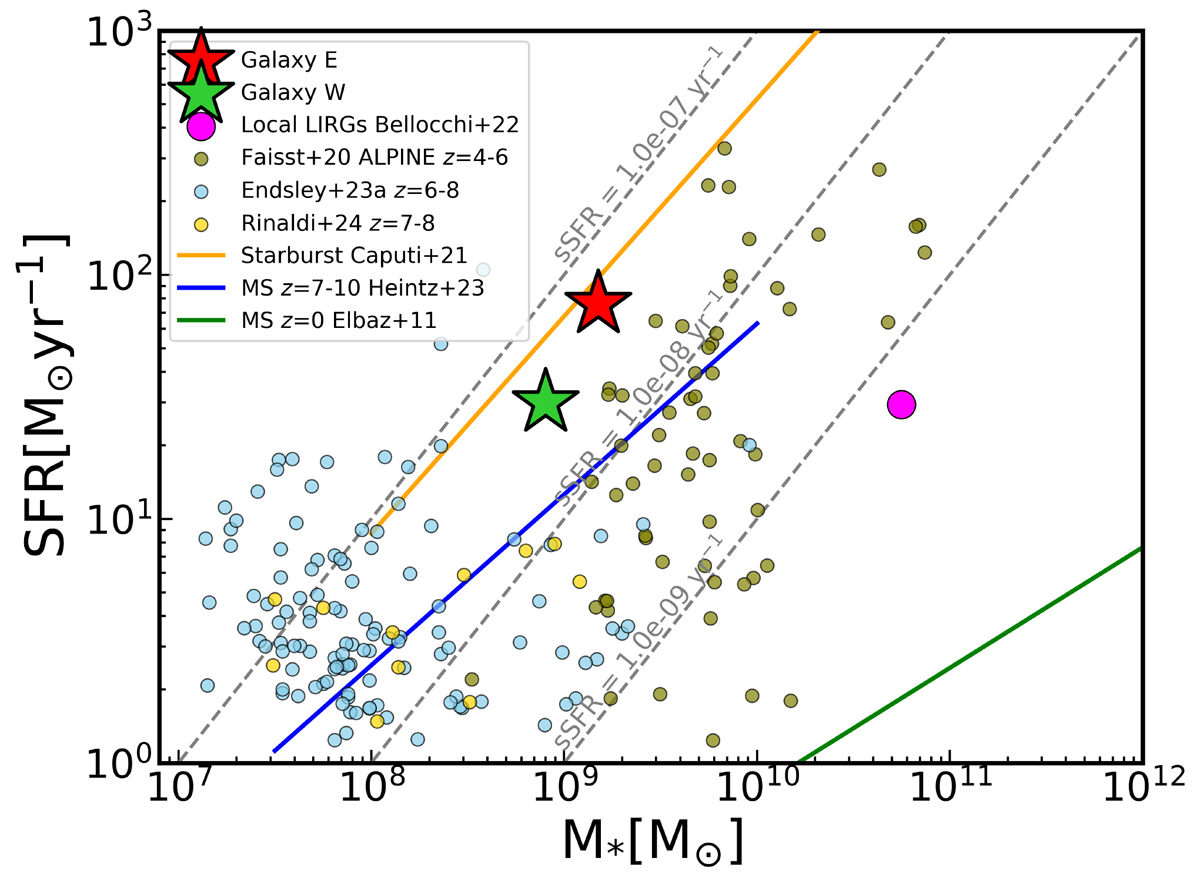
Download original image
Stellar-mass recent SFR diagram. The large red star represents galaxy E, and the large green star represents galaxy W. We use the SFR traced by Hα for solar metallicities. The orange line delimits the starburst area (Caputi et al. 2017). The blue line represents the MS for galaxies derived for redshift 7, and the green line shows the one for galaxies at redshift 0 (Heintz et al. 2023; Elbaz et al. 2011). The dashed gray lines represent the lines of constant sSFR. We also present galaxies of redshifts 6–8 (Endsley et al. 2023) (blue dots), the main-sequence galaxies of ALPINE at redshifts 4.4–5.9 (Faisst et al. 2020; Le Fèvre et al. 2020) (olive dots), strong Hα-emitters (HAEs) at z ≈ 7–8 (Rinaldi et al. 2024b) (yellow dots) and the mean for the LIRG sample (Bellocchi et al. 2022) (pink dot).
Current usage metrics show cumulative count of Article Views (full-text article views including HTML views, PDF and ePub downloads, according to the available data) and Abstracts Views on Vision4Press platform.
Data correspond to usage on the plateform after 2015. The current usage metrics is available 48-96 hours after online publication and is updated daily on week days.
Initial download of the metrics may take a while.