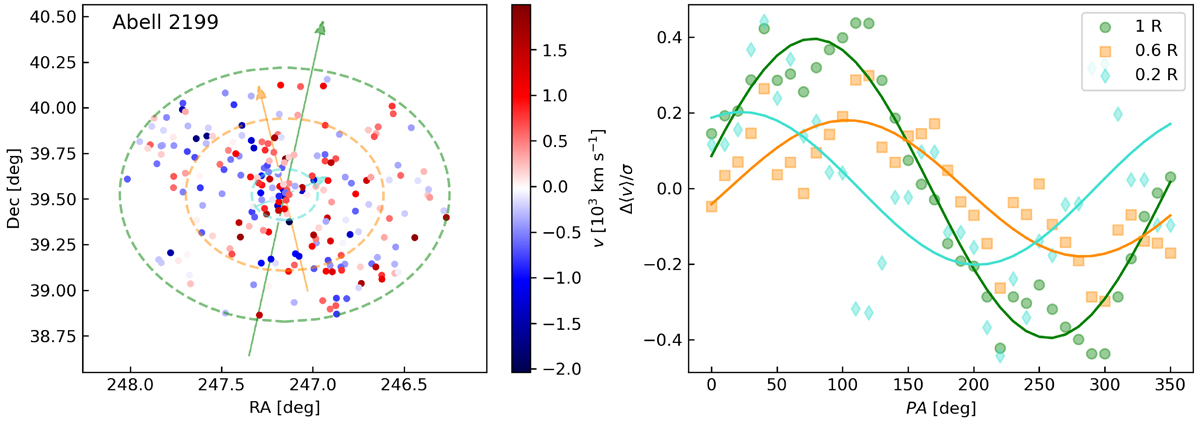
Fig. 1.
Download original image
Example of the fitting procedure used to search for systematic rotation of the galactic component in clusters of galaxies. Left: Projected spatial distribution of galaxies of Abell 2199, colour-coded according to their line-of-sight velocity relative to the cluster mean (v). The dashed contours represent three different cuts within which we performed the test, in order to monitor whether the velocity amplitude would increase or decrease and how the axis position angle changes with radius. Right: Corresponding sine fits, from which we extracted the parameters related to the largest scale (R) reported in Table 2.
Current usage metrics show cumulative count of Article Views (full-text article views including HTML views, PDF and ePub downloads, according to the available data) and Abstracts Views on Vision4Press platform.
Data correspond to usage on the plateform after 2015. The current usage metrics is available 48-96 hours after online publication and is updated daily on week days.
Initial download of the metrics may take a while.