Fig. 2.
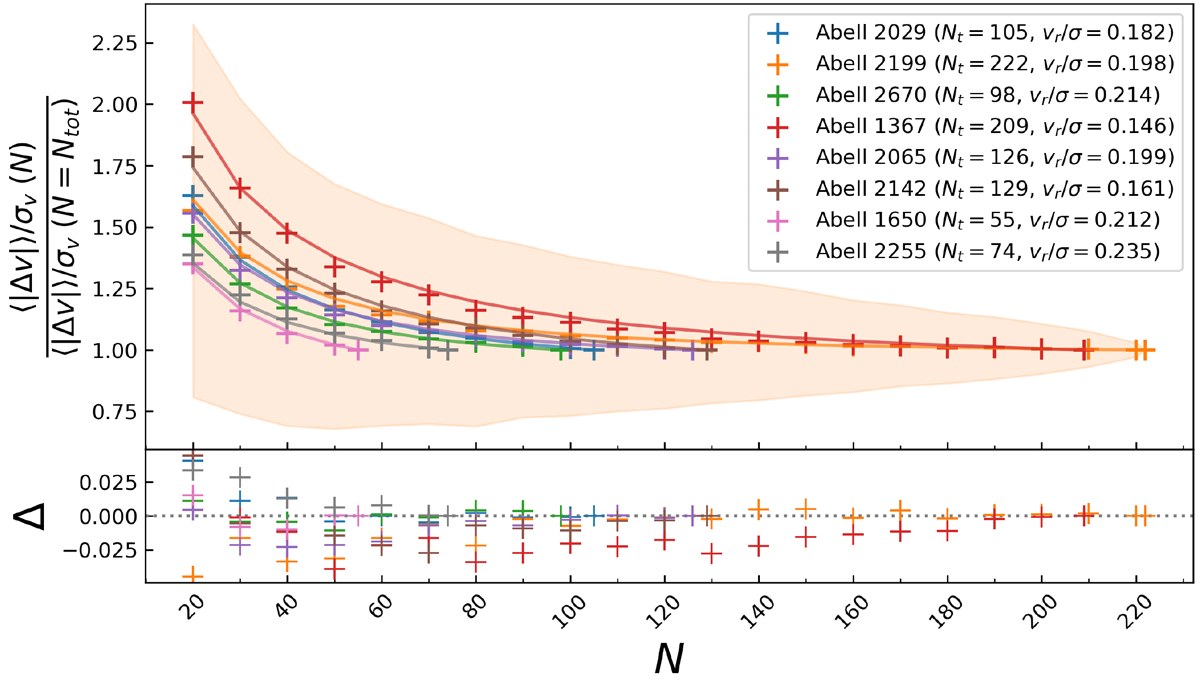
Download original image
Upper panel: Low-number bias for the eight clusters selected in this paper compared to the related analytical curve with the best-fit ρ = −0.788. To illustrate the statistical uncertainty without overcrowding the graph, we only show the A2199 one-sigma error band forreference. Lower panel: Residuals, Δ, between the data points and the analytical curves. In the legend, we use Nt = Ntot, vr = vrot, and σ calculated as the standard deviation of the full set of galaxies (this is what ultimately causes the difference between the values of vr/σ reported here and the vrot/σfit in Table 2, where σfit is extracted from the Gaussian fit of the redshift distribution). The case of N = 10 was excluded from the analysis, as undesired additional systematic effects are expected to appear with such a small number of galaxies.
Current usage metrics show cumulative count of Article Views (full-text article views including HTML views, PDF and ePub downloads, according to the available data) and Abstracts Views on Vision4Press platform.
Data correspond to usage on the plateform after 2015. The current usage metrics is available 48-96 hours after online publication and is updated daily on week days.
Initial download of the metrics may take a while.