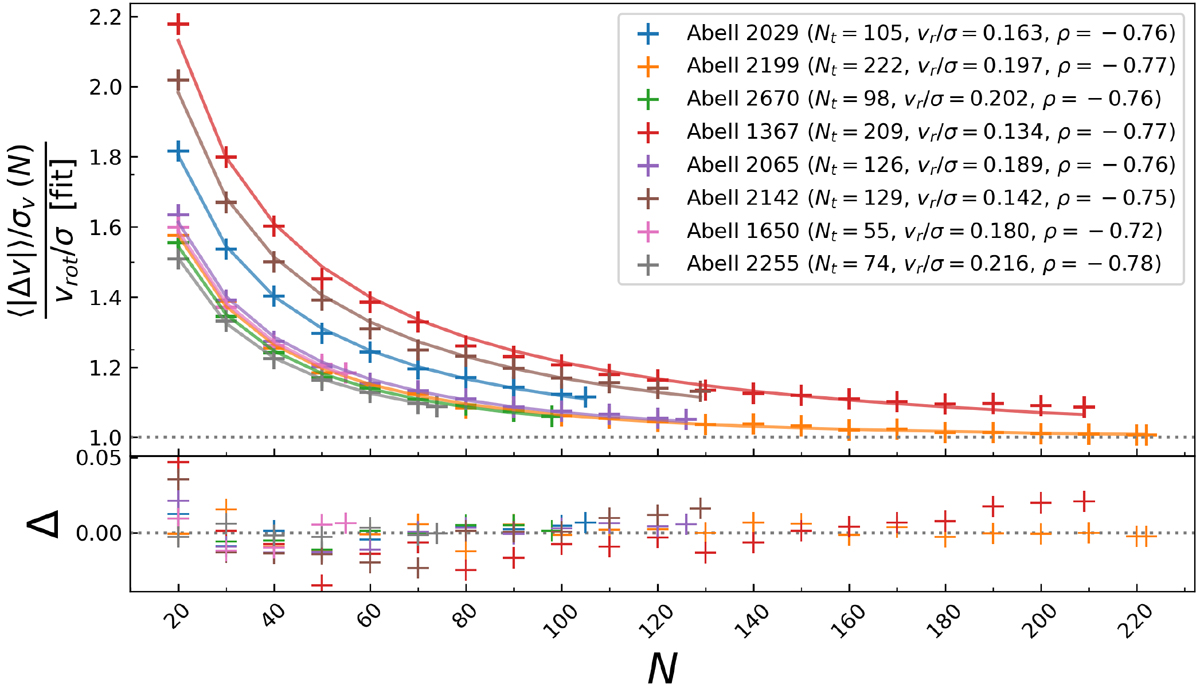
Fig. C.1.
Download original image
Low-number bias trends of the eight selected clusters in the paper as a function of the number N of galaxies included in the analysis. The continuous lines are our model best fit curves to the data, where both vrot/σ and ρ are free parameters. Their fitted values are reported in the legend, alongside the total number of galaxies Nt = Ntot.
Current usage metrics show cumulative count of Article Views (full-text article views including HTML views, PDF and ePub downloads, according to the available data) and Abstracts Views on Vision4Press platform.
Data correspond to usage on the plateform after 2015. The current usage metrics is available 48-96 hours after online publication and is updated daily on week days.
Initial download of the metrics may take a while.