Fig. 2.
Download original image
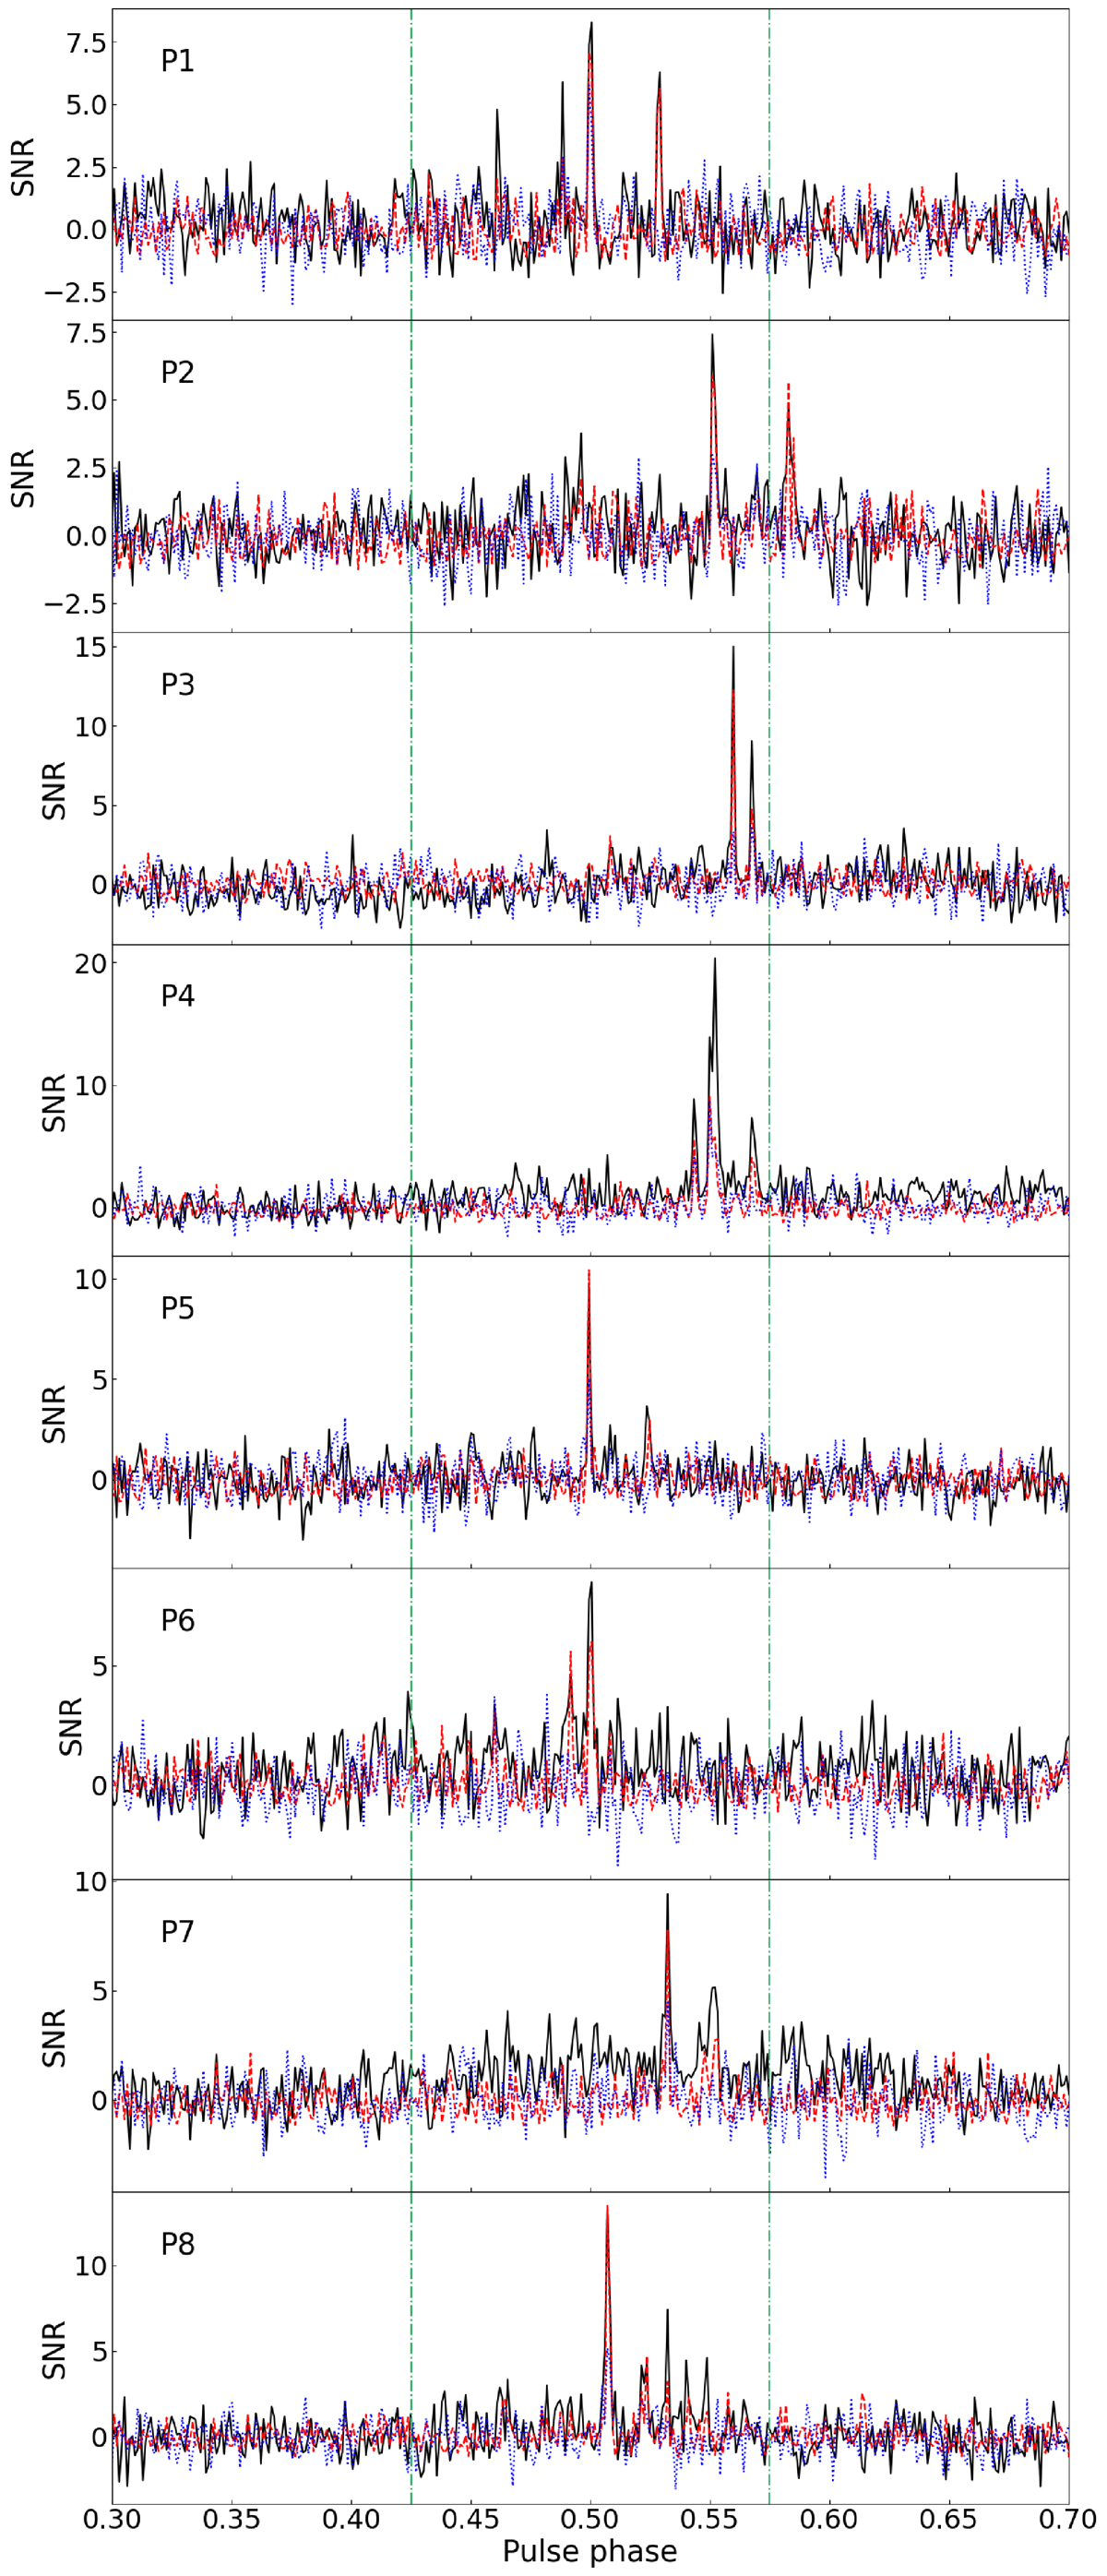
Arrival phase of the pulses from PSR J1745-2900. Each pulse profile is displayed in intensity (Stokes I), linear (L) and circular (V) polarisation in black, red and blue, respectively. The time series has been downsampled by a factor of 128 (4.1 ms of time resolution). The green dashed vertical lines show the regions where the pulses are expected to arrive. We calculated the TOAs of each reported pulse, with respect to the barycentre and infinite frequency.
Current usage metrics show cumulative count of Article Views (full-text article views including HTML views, PDF and ePub downloads, according to the available data) and Abstracts Views on Vision4Press platform.
Data correspond to usage on the plateform after 2015. The current usage metrics is available 48-96 hours after online publication and is updated daily on week days.
Initial download of the metrics may take a while.