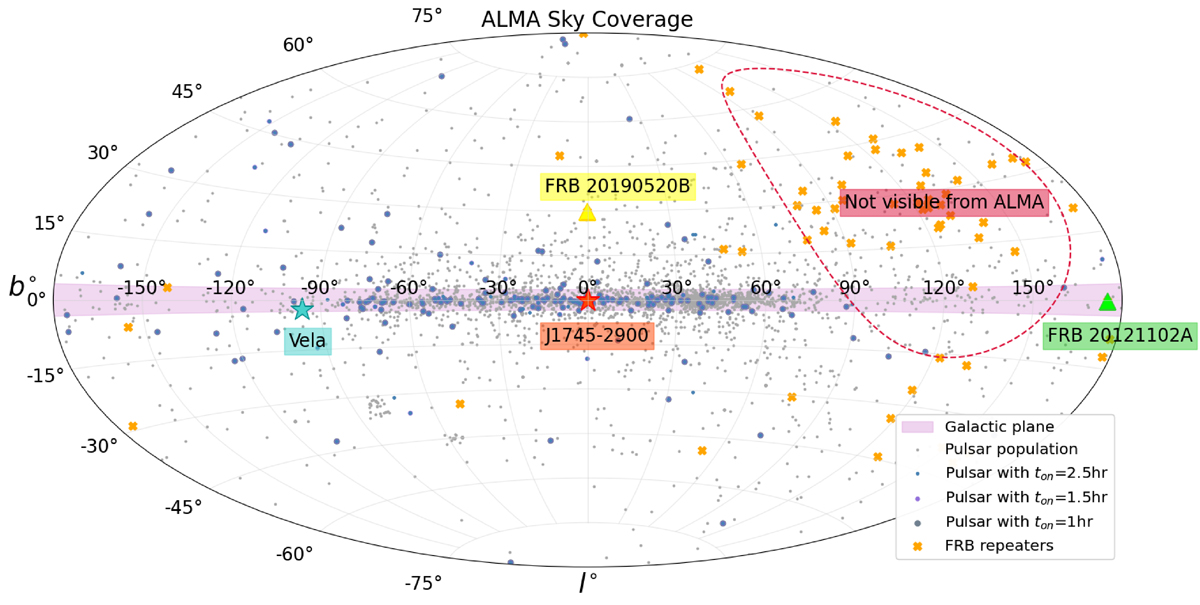
Fig. 4.
Download original image
ALMA visibility. The dots correspond to the known pulsar population, where the size of the dots scales inversely with the integration time needed for detection. Larger dots indicate lower integration times. The orange crosses correspond to the repeating FRBs. Some remarkable sources are shown with special icons: stars for pulsars and triangles for FRBs.
Current usage metrics show cumulative count of Article Views (full-text article views including HTML views, PDF and ePub downloads, according to the available data) and Abstracts Views on Vision4Press platform.
Data correspond to usage on the plateform after 2015. The current usage metrics is available 48-96 hours after online publication and is updated daily on week days.
Initial download of the metrics may take a while.