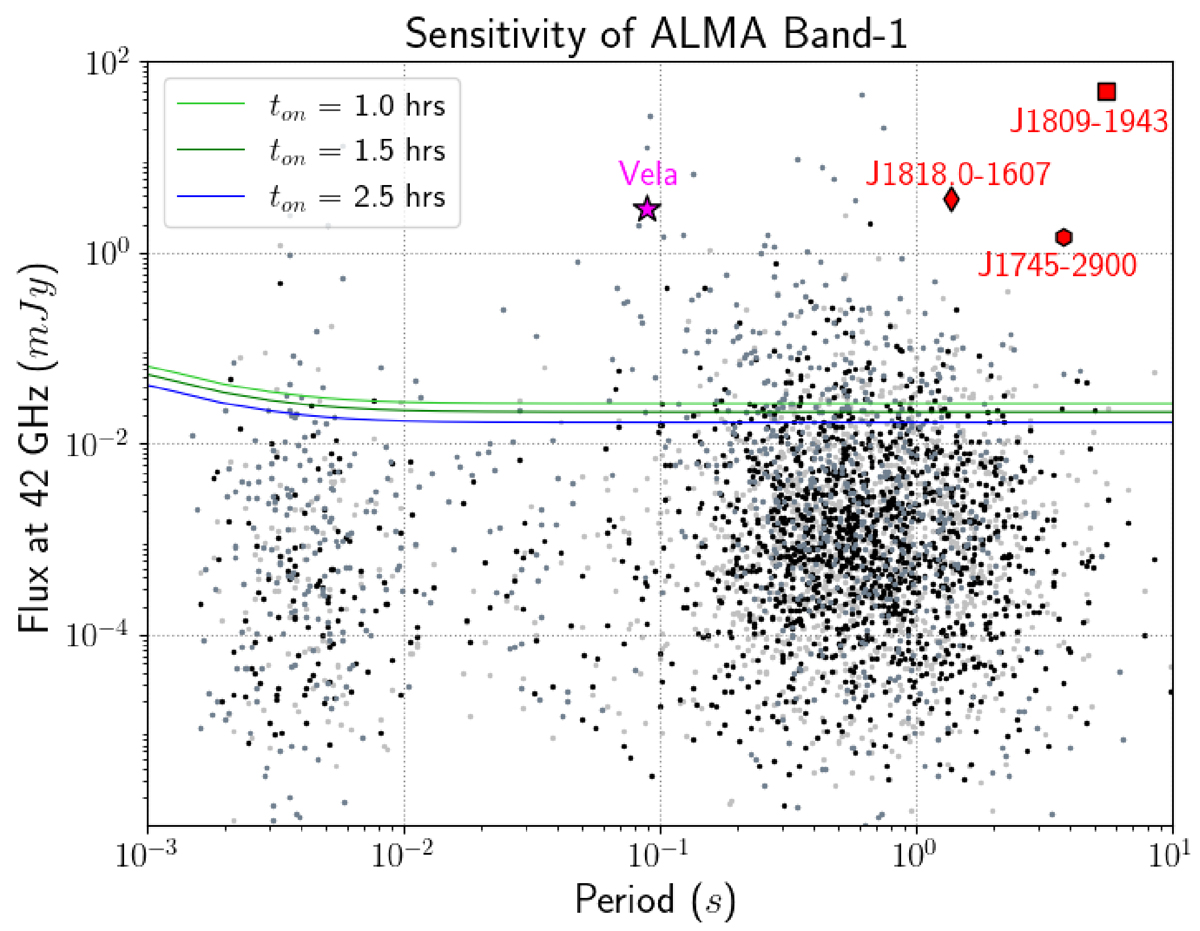
Fig. 5.
Download original image
Predicted sensitivity of ALMA Band 1 to the known pulsar population. The black dots are the pulsars with reported spectral index, the grey dots are those without spectral index and from which we draw values from a normal distribution. The sources detectable lie above the threshold lines of integration times of 1 h (light green), 1.5 h (green) and 2.5 h (blue). The light grey dots are pulsars not visible to ALMA due to the declination limit (< 47°). Based on Fig. 9 in Liu et al. (2021).
Current usage metrics show cumulative count of Article Views (full-text article views including HTML views, PDF and ePub downloads, according to the available data) and Abstracts Views on Vision4Press platform.
Data correspond to usage on the plateform after 2015. The current usage metrics is available 48-96 hours after online publication and is updated daily on week days.
Initial download of the metrics may take a while.