Fig. 1.
Download original image
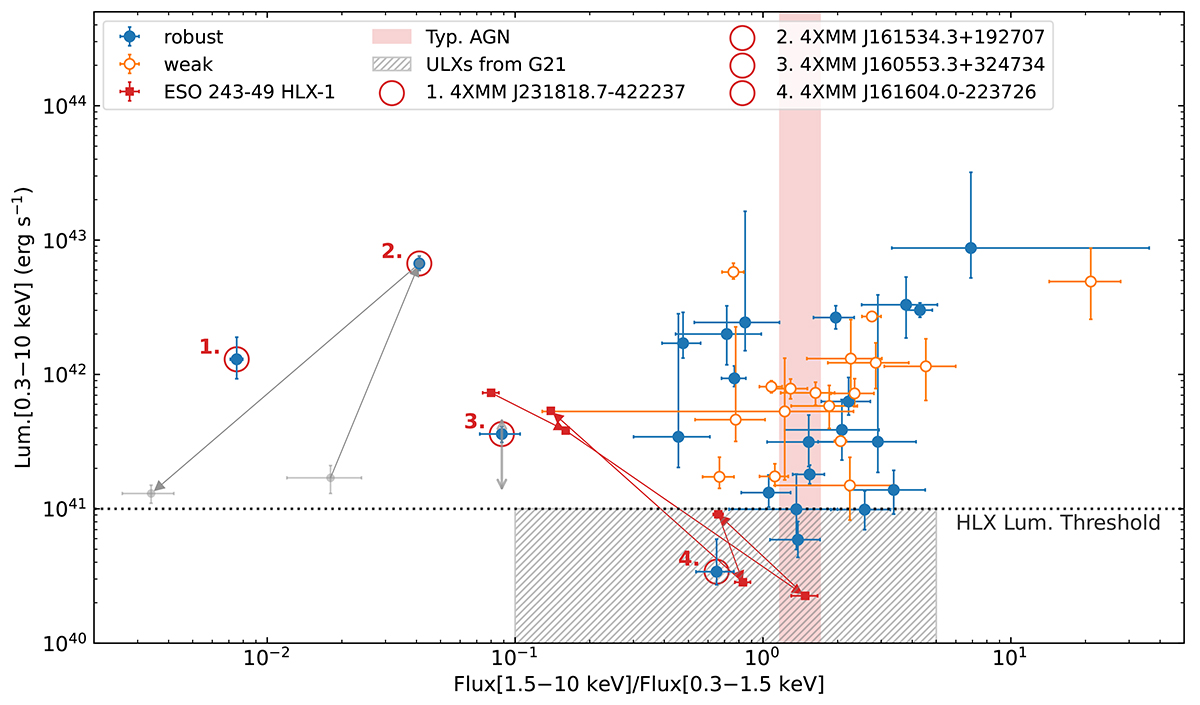
Hardness-luminosity diagram (HLD) of the sample of HLX candidates considered in this work. Blue filled dots are for sources with a robust association to the host galaxy and empty orange dots for weak associations. The red vertical area indicates the position on the HLD of a typical AGN, with a power law index between 1.8 and 2 (fluxes computed with WebPIMMS; see https://heasarc.gsfc.nasa.gov/cgi-bin/Tools/w3pimms/w3pimms.pl). The grey dashed area correspond to the parameter space covered in Gúrpide et al. (2021). The dotted line indicates the conventional HLX luminosity threshold of 1 × 1041 erg s−1. The long-term spectral evolution of ESO 243–49 HLX-1 is shown in red squares and arrows. The four most interesting candidates analysed in this work (cf. Sect. 5) are marked with red circles and numbered. For those with available data, the long-term evolution or the HR range is reported with grey data points and arrows.
Current usage metrics show cumulative count of Article Views (full-text article views including HTML views, PDF and ePub downloads, according to the available data) and Abstracts Views on Vision4Press platform.
Data correspond to usage on the plateform after 2015. The current usage metrics is available 48-96 hours after online publication and is updated daily on week days.
Initial download of the metrics may take a while.