Open Access
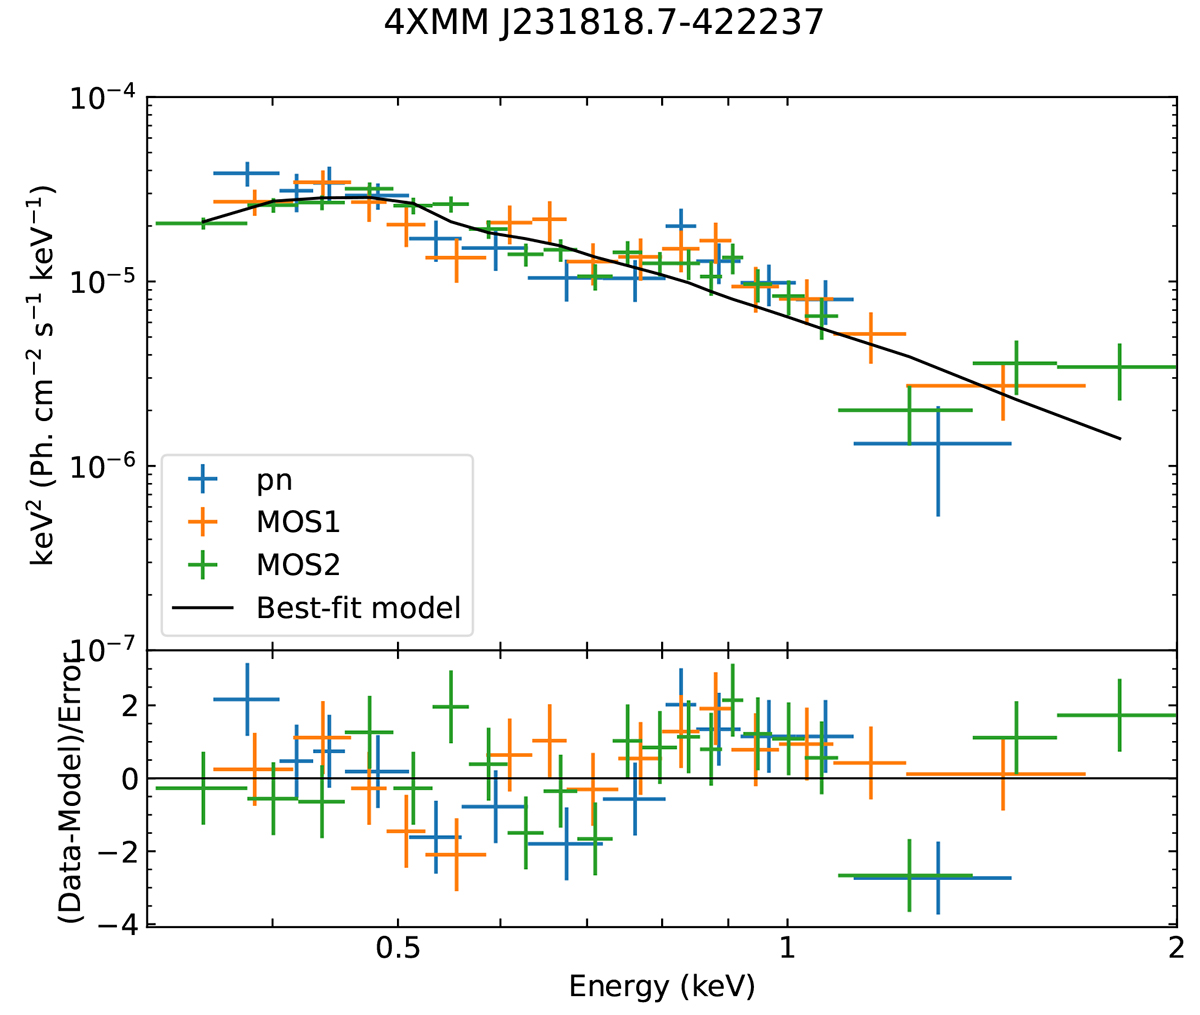
Fig. 3.
Download original image
Fit of the EPIC spectrum of 4XMM J231818.7-422237. Top panel: pn (blue), MOS1 (orange), and MOS2 (green) data points and best-fit absorbed power law model (black line). Bottom panel: Residuals of the fit. The spectrum has been rebinned for a better visualisation. The background becomes dominant above ≳1 keV.
Current usage metrics show cumulative count of Article Views (full-text article views including HTML views, PDF and ePub downloads, according to the available data) and Abstracts Views on Vision4Press platform.
Data correspond to usage on the plateform after 2015. The current usage metrics is available 48-96 hours after online publication and is updated daily on week days.
Initial download of the metrics may take a while.