Fig. 1.
Download original image
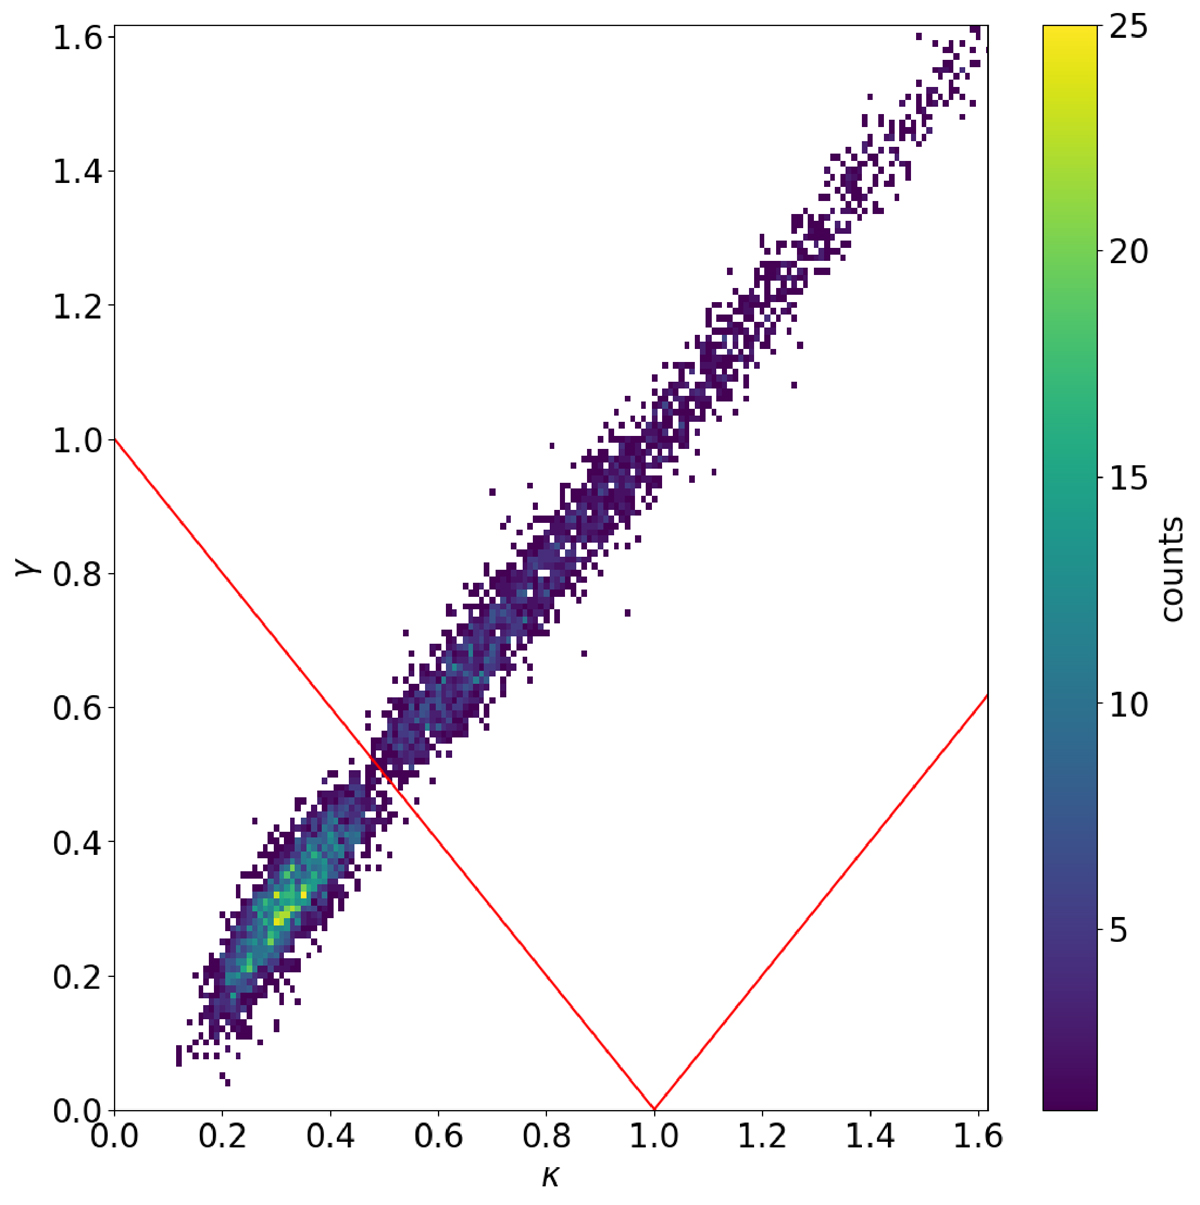
Two-dimensional histogram of κ and γ values computed for the selected lensed images from the OM10 catalog. The color in each bin represents the count number. The red solid line indicates where μmacro → ∞ separating minimum (below) from saddle (above) images. We note that κ ≈ γ is due to describing the mass distribution of the lenses with a SIE + γext.
Current usage metrics show cumulative count of Article Views (full-text article views including HTML views, PDF and ePub downloads, according to the available data) and Abstracts Views on Vision4Press platform.
Data correspond to usage on the plateform after 2015. The current usage metrics is available 48-96 hours after online publication and is updated daily on week days.
Initial download of the metrics may take a while.