Open Access
Fig. 4.
Download original image
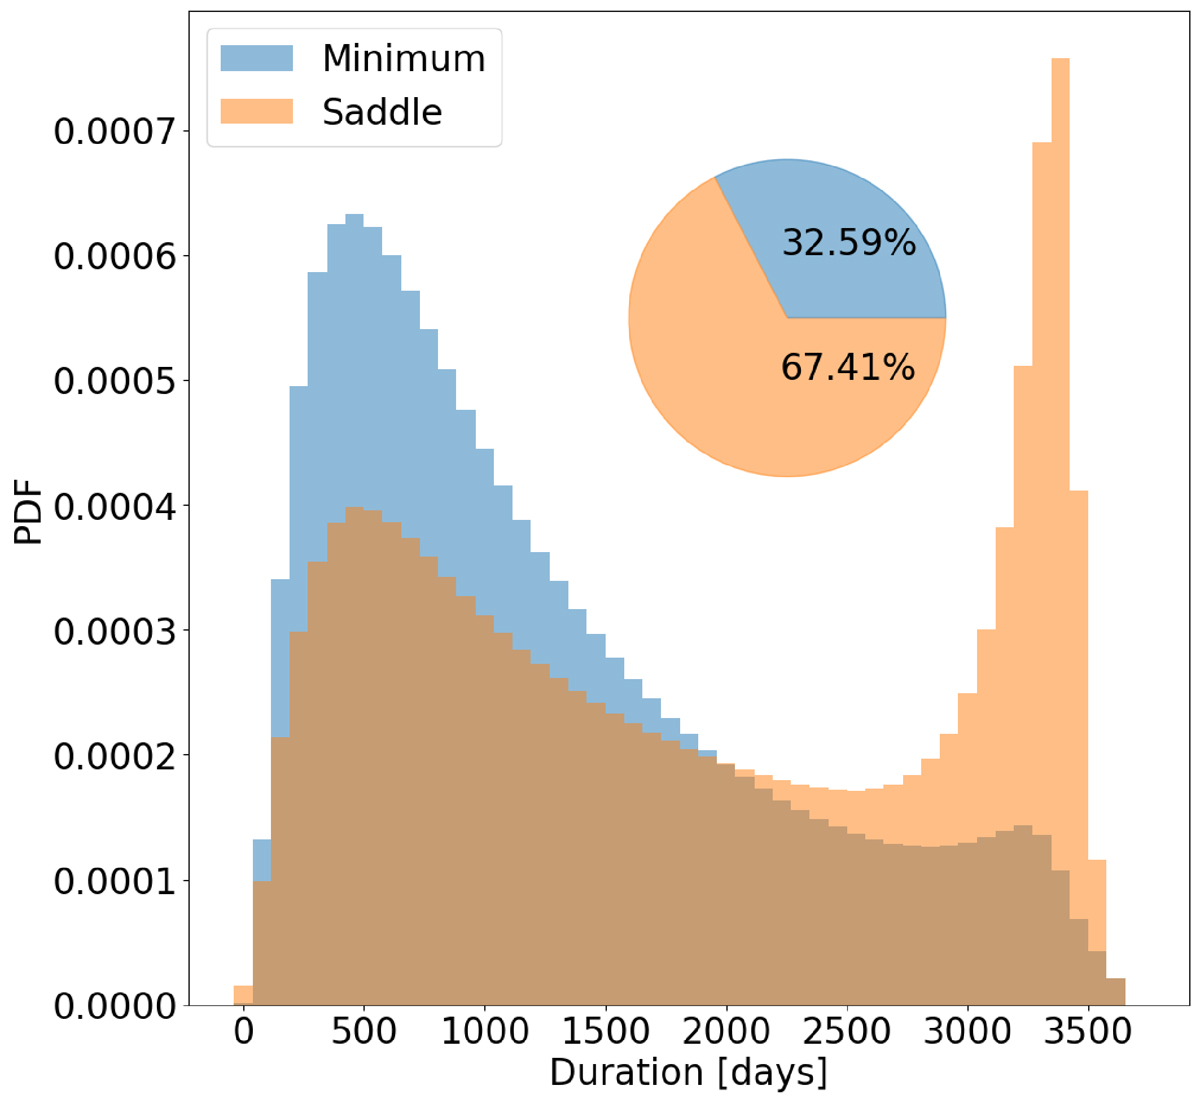
Duration of all HMEs per image parity. We note that the peak at ∼3300 [days] corresponds to events that last longer than the 10 years of the light curves. As per Fig. 3, the pie chart represents the total area fraction of each histogram, i.e. ∼32% of the events belong to a minimum image.
Current usage metrics show cumulative count of Article Views (full-text article views including HTML views, PDF and ePub downloads, according to the available data) and Abstracts Views on Vision4Press platform.
Data correspond to usage on the plateform after 2015. The current usage metrics is available 48-96 hours after online publication and is updated daily on week days.
Initial download of the metrics may take a while.