Fig. 1.
Download original image
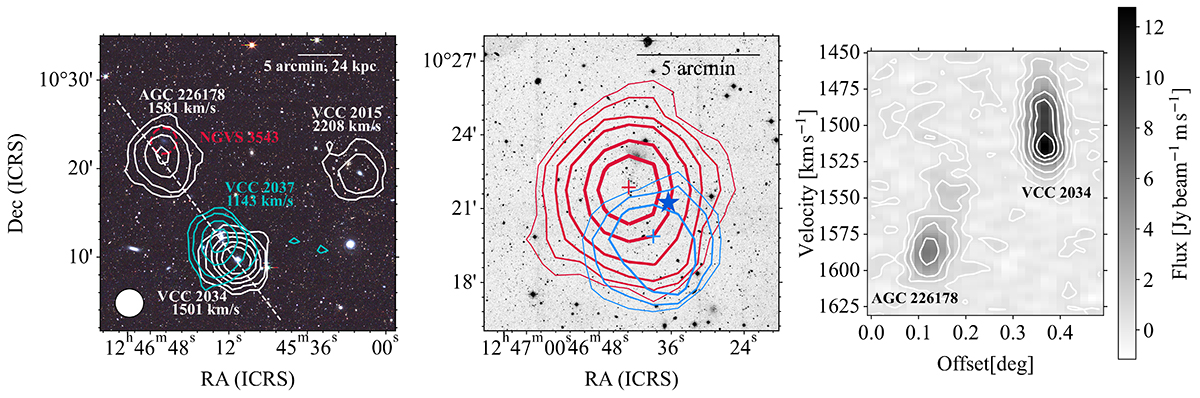
Left: DECaLS g, r, z composite colour image overlaid with integrated H I emission (moment 0 map) contours from the FAST observation. The contour levels are (0.3, 1.1, 4.2, 8.4, 16.8) × 1018 cm−2. The beam is shown as the white circle in the bottom left corner (3.24′×3.24′). The scale bar in the top right corner illustrates the angular size and its corresponding physical scale, assuming a distance of 16.5 Mpc. The white dashed line running through AGC 226178 represent the directions adopted to extract the position-velocity diagrams shown in the right panels. Middle: Zoomed-image of NGVS g-band centred on AGC 226178 overlaid with FAST contours, red for the main body, blue for the tail of AGC 226178. The contour levels are (0.3, 0.5, 1.1, 2.1, 4.2, 6.3) × 1018 cm−2. The position of BC12 is indicated by the blue star. Right: FAST H I position–velocity diagram extracted along the dashed line shown in the left panel. The extraction slit is 3′ wide (centred on the dashed line), matching the beam size of the FAST resolution. The x-axis indicates the offset along the dashed line, measured from the reference position (RA, Dec) = ![]() ,
, ![]() . The contours are drawn at 0.4, 1.2, 2.5, 5.0, 7.4, and 9.9 mJy beam−1, approximately 1σ, 3σ, 6σ, 12σ, 18σ, and 24σ (over a single channel which corresponds to 1.61 km s−1). VCC 2037 (∼1150 km s−1) does not appear in the diagram as it is well beyond the plotted velocity range.
. The contours are drawn at 0.4, 1.2, 2.5, 5.0, 7.4, and 9.9 mJy beam−1, approximately 1σ, 3σ, 6σ, 12σ, 18σ, and 24σ (over a single channel which corresponds to 1.61 km s−1). VCC 2037 (∼1150 km s−1) does not appear in the diagram as it is well beyond the plotted velocity range.
Current usage metrics show cumulative count of Article Views (full-text article views including HTML views, PDF and ePub downloads, according to the available data) and Abstracts Views on Vision4Press platform.
Data correspond to usage on the plateform after 2015. The current usage metrics is available 48-96 hours after online publication and is updated daily on week days.
Initial download of the metrics may take a while.