Open Access
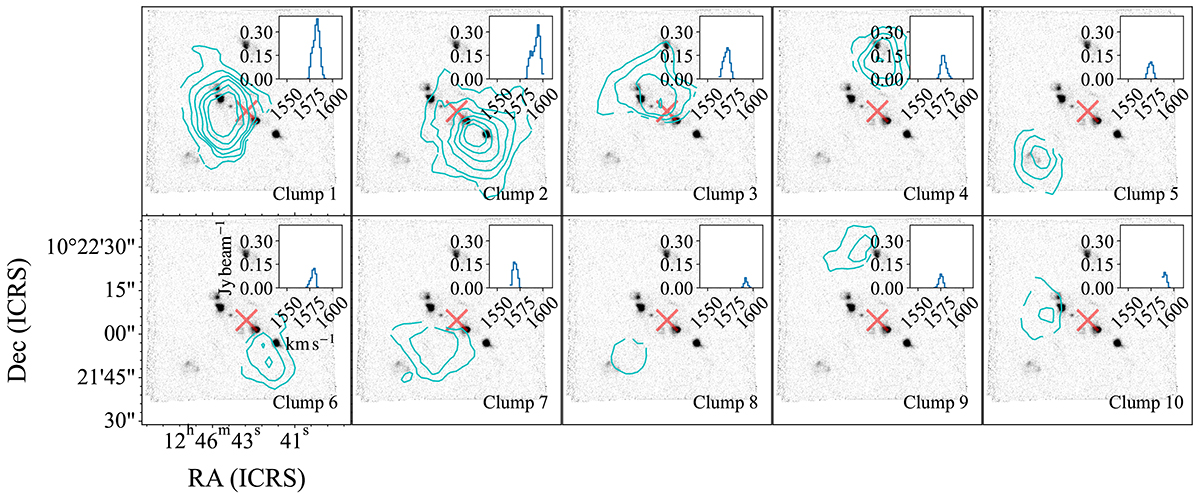
Fig. 10.
Download original image
Contour maps of the brightest H I clumps detected in the natural-weighted VLA image cube. The background displays the Hα line emission image constructed from the MUSE datacube. The inset plot in each panel shows the H I spectrum of each clump. The red cross indicates the centre of AGC 226178.
Current usage metrics show cumulative count of Article Views (full-text article views including HTML views, PDF and ePub downloads, according to the available data) and Abstracts Views on Vision4Press platform.
Data correspond to usage on the plateform after 2015. The current usage metrics is available 48-96 hours after online publication and is updated daily on week days.
Initial download of the metrics may take a while.