Fig. 11.
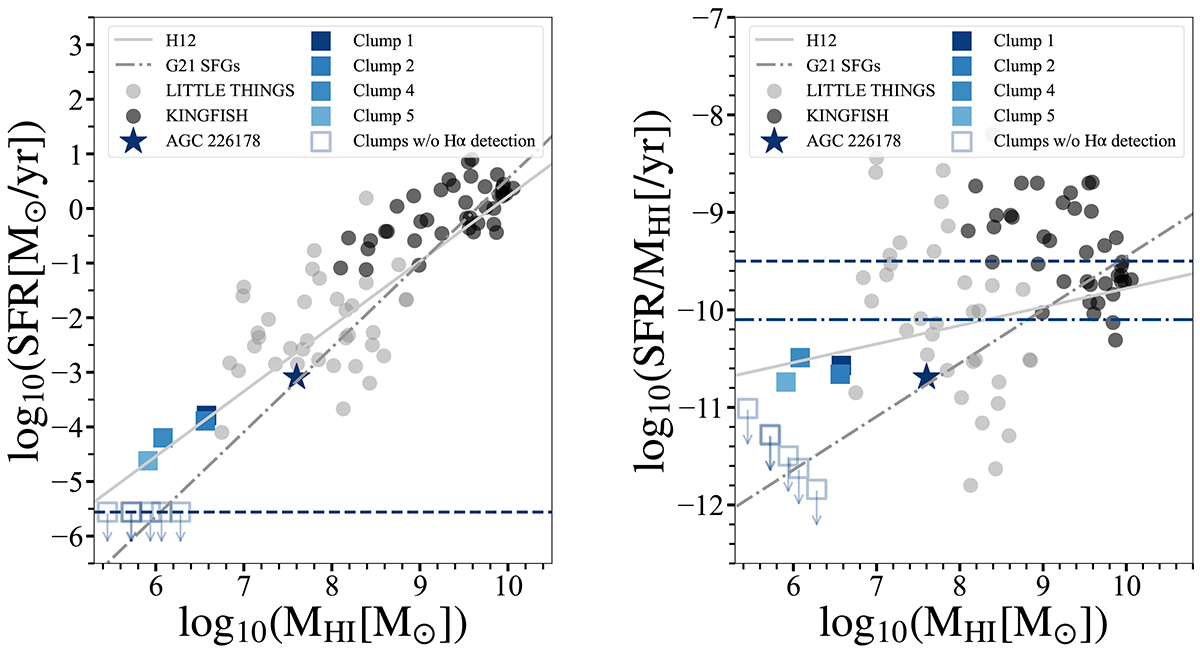
Download original image
Left: H I mass vs the star formation rate (SFR) diagram for the H I clumps, AGC 226178 as a whole and literature samples of nearby galaxies; Right: H I-based star formation efficiency vs H I mass. The solid blue squares represent the H I clumps associated with H II regions in AGC 226178, whereas the hollow squares represent H I clumps not associated with star formation. The SFR for the hollow squares are arbitrarily set to the 3σ detection limit of SFR. The grey and black circles are star-forming galaxies from the Local Irregulars That Trace Luminosity Extremes, The HI Nearby Galaxy Survey (LITTLE THINGS) sample (Hunter et al. 2012) and Key Insights on Nearby Galaxies: a Far-Infrared Survey with Herschel (KINGFISH) sample (Kennicutt et al. 2011). The grey solid and dash-dotted lines indicate the observed average relation of nearby galaxies from Huang et al. (2012) and Guo et al. (2021), respectively. In the right panel, the dashed horizontal line corresponds to the reciprocal of the Hubble time, whereas the dash-dotted horizontal line indicates the average value obtained by Schiminovich et al. (2010) for the GASS sample.
Current usage metrics show cumulative count of Article Views (full-text article views including HTML views, PDF and ePub downloads, according to the available data) and Abstracts Views on Vision4Press platform.
Data correspond to usage on the plateform after 2015. The current usage metrics is available 48-96 hours after online publication and is updated daily on week days.
Initial download of the metrics may take a while.