Fig. 12.
Download original image
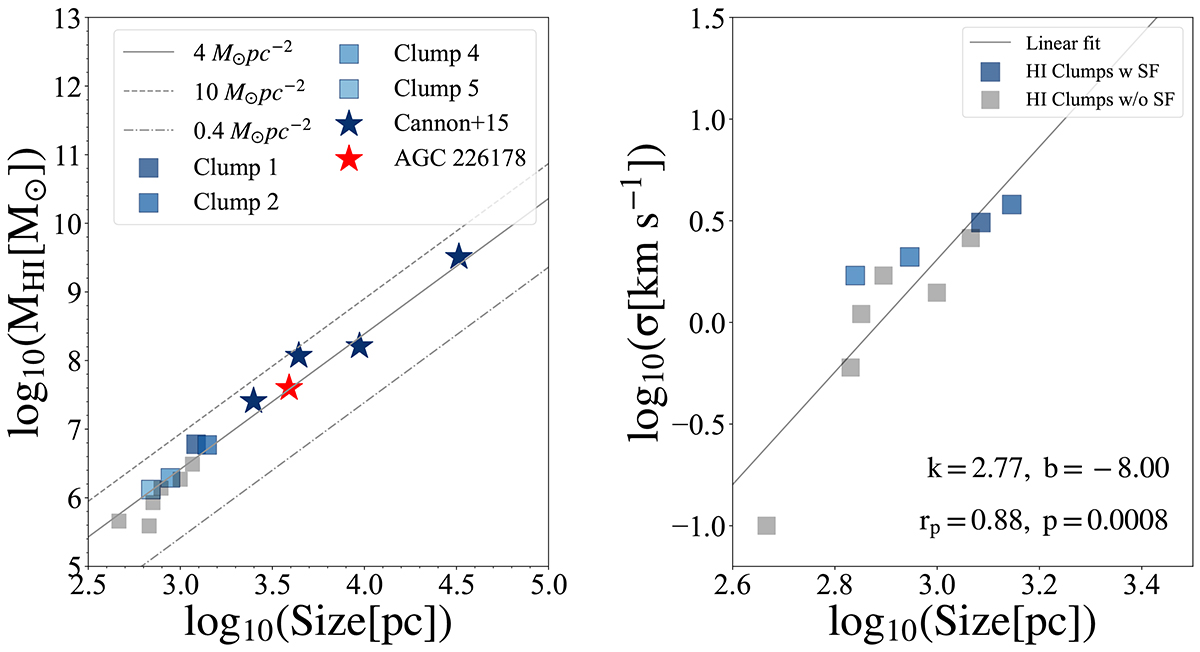
Left: The H I mass-size relation of H I clumps in AGC 226178 and literature sample of almost dark H I clouds. The size of each clump is computed as ![]() , where A is the projected area estimated from the geometric mean of the major and minor axes in Table B.1. Dashed lines indicate the critical surface density for H I-to-H2 transition predicted by different models and physical conditions, as indicated in the legend. Stars indicate five almost dark H I clouds investigated by Cannon et al. (2015). The grey lines mark the critical surface density for the atomic-to-molecular gas transition, as predicted by some models. For a detailed discussion of the physical significance of different thresholds, see Section 3.5. Right: The size versus velocity dispersion distribution of H I clumps. In both panels, H I clumps associated with H II regions are plotted with blue filled squares, whereas the others are plotted with filled grey squares. The solid line in the right panel represents the best-fit size-velocity dispersion relation. The best-fit logarithmic slope (k), intercept (b), and the Pearson’s correlation coefficient and p-value are also indicated in the right panel.
, where A is the projected area estimated from the geometric mean of the major and minor axes in Table B.1. Dashed lines indicate the critical surface density for H I-to-H2 transition predicted by different models and physical conditions, as indicated in the legend. Stars indicate five almost dark H I clouds investigated by Cannon et al. (2015). The grey lines mark the critical surface density for the atomic-to-molecular gas transition, as predicted by some models. For a detailed discussion of the physical significance of different thresholds, see Section 3.5. Right: The size versus velocity dispersion distribution of H I clumps. In both panels, H I clumps associated with H II regions are plotted with blue filled squares, whereas the others are plotted with filled grey squares. The solid line in the right panel represents the best-fit size-velocity dispersion relation. The best-fit logarithmic slope (k), intercept (b), and the Pearson’s correlation coefficient and p-value are also indicated in the right panel.
Current usage metrics show cumulative count of Article Views (full-text article views including HTML views, PDF and ePub downloads, according to the available data) and Abstracts Views on Vision4Press platform.
Data correspond to usage on the plateform after 2015. The current usage metrics is available 48-96 hours after online publication and is updated daily on week days.
Initial download of the metrics may take a while.