Fig. 13.
Download original image
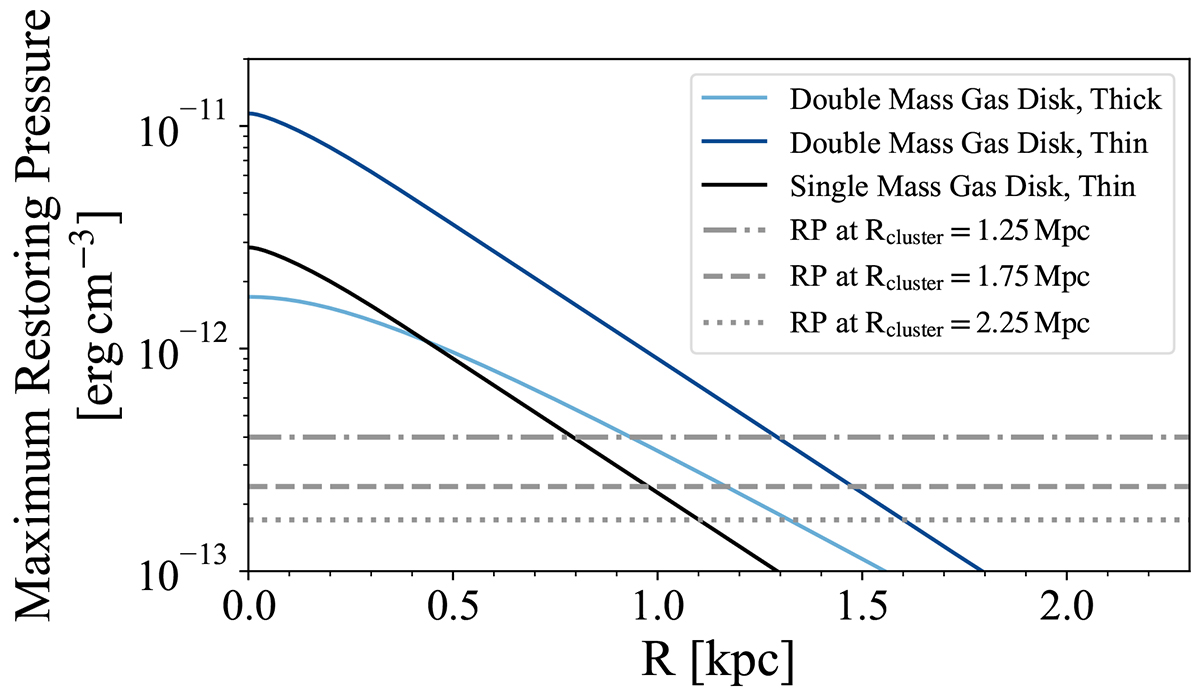
Galactic radius vs the maximum restoring pressure by self-gravity of a gas disc. The solid black curve is for a thin gas disc with mass equal to that of AGC 226178, the solid dark blue curve for a thin gas disc mass twice that of AGC 226178, and the solid light blue curve for a thick gas disc of twice the mass of AGC 226178. The horizontal lines indicate ram pressure (RP) levels at three different cluster-centric distances from Virgo. The H I gas is stripped if the ram pressure is larger than the maximum restoring pressure. See Section 4.2.2 for details.
Current usage metrics show cumulative count of Article Views (full-text article views including HTML views, PDF and ePub downloads, according to the available data) and Abstracts Views on Vision4Press platform.
Data correspond to usage on the plateform after 2015. The current usage metrics is available 48-96 hours after online publication and is updated daily on week days.
Initial download of the metrics may take a while.