Open Access
Fig. A.1.
Download original image
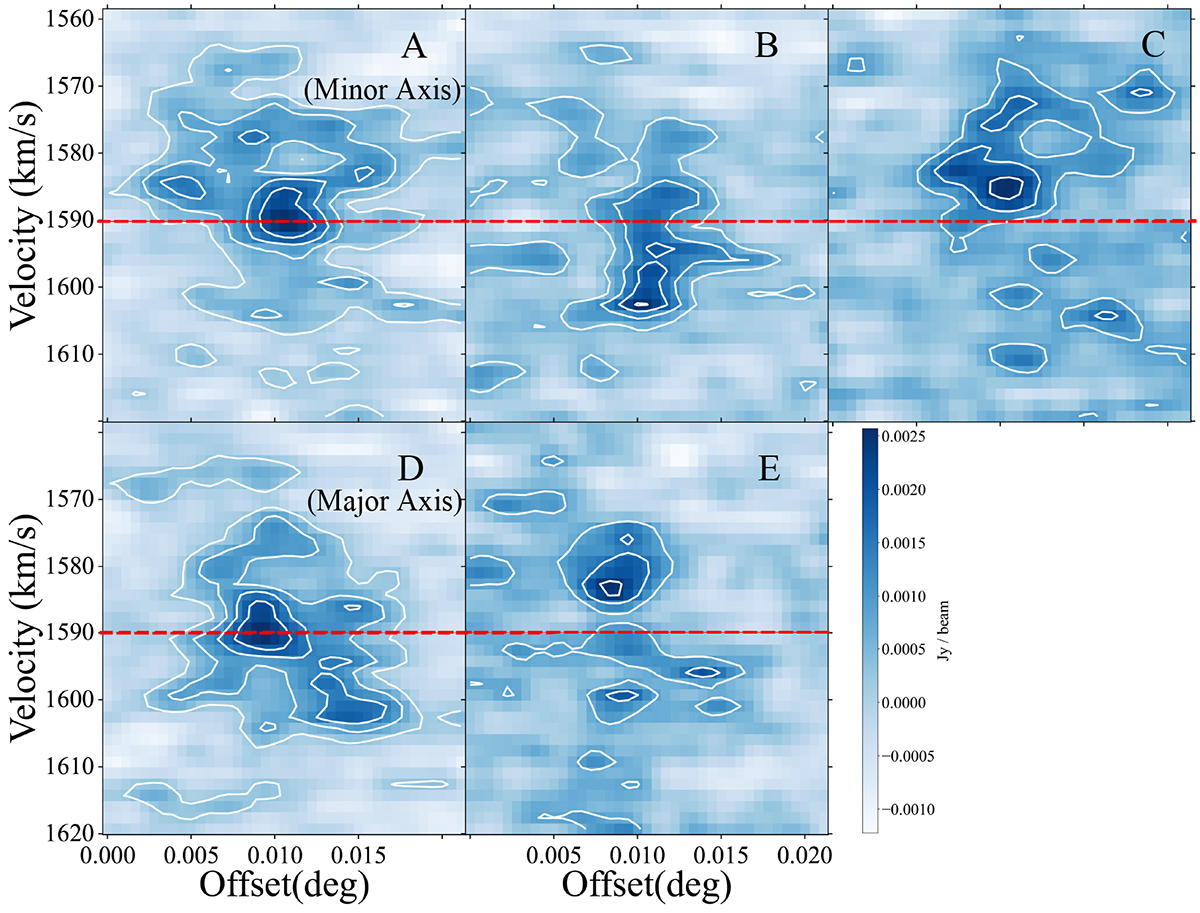
PV diagrams extracted along the directions indicated in the bottom middle panel of Fig.5, where slit A indicates the minor axis of AGC 226178 and slit D indicates the major axis. The contours represent 2, 4, 6, 8, and 12 times the RMS noise of 0.4 mJy beam−1 channel−1
Current usage metrics show cumulative count of Article Views (full-text article views including HTML views, PDF and ePub downloads, according to the available data) and Abstracts Views on Vision4Press platform.
Data correspond to usage on the plateform after 2015. The current usage metrics is available 48-96 hours after online publication and is updated daily on week days.
Initial download of the metrics may take a while.