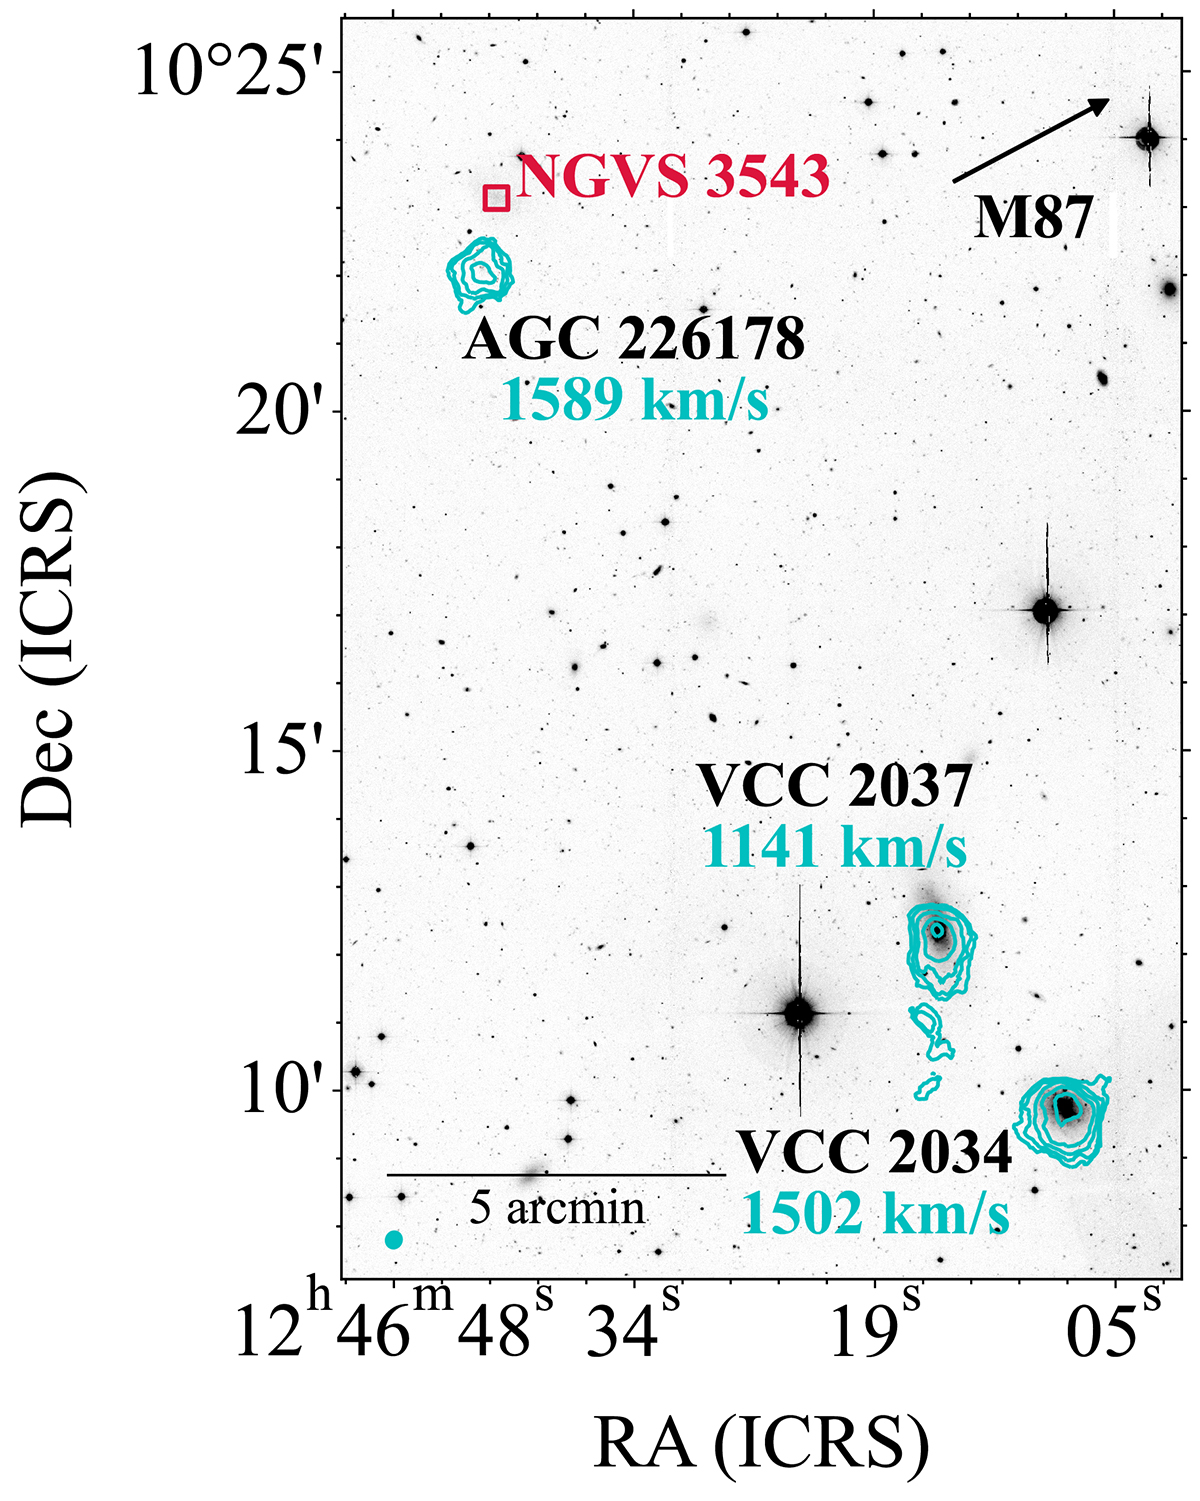
Fig. 2.
Download original image
Natural-weighted VLA moment-0 map showing all detected sources in the field, including AGC 226178, VCC 2034, and VCC 2037. Cyan contours represent column density of (0.4, 0.8, 1.6, 3.2, 6.4) × 1020 cm−2. The central velocity of each source was measured from the masked VLA data cube. The location of NGVS 3543, which is not detected in the VLA data, is indicated by the crimson rectangle. The arrow indicates the direction towards M87, and the cyan ellipse in the lower left corner represents the beam size of the moment maps.
Current usage metrics show cumulative count of Article Views (full-text article views including HTML views, PDF and ePub downloads, according to the available data) and Abstracts Views on Vision4Press platform.
Data correspond to usage on the plateform after 2015. The current usage metrics is available 48-96 hours after online publication and is updated daily on week days.
Initial download of the metrics may take a while.