Fig. 4.
Download original image
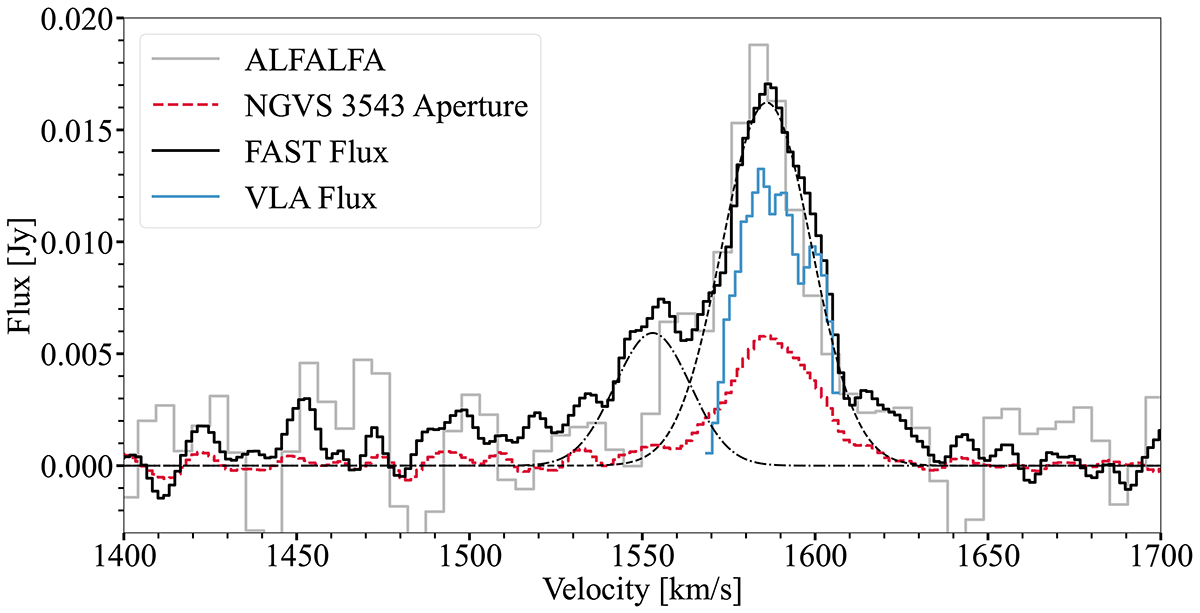
H I spectra of AGC 226178 from ALFALFA, FAST, and the VLA. The grey curve is the public ALFALFA spectrum from Haynes et al. (2018); the blue curve is for the natural-weighted cube of the VLA; the black curve is the FAST spectrum extracted using a 4.2′×3.5′ elliptical aperture centred on AGC 226178; the dashed line represents the Gaussian fit for the main component, whereas the dash-dotted line corresponds to a fit of a Gaussian to the second part of the system (i.e. the low-velocity extension in the position velocity diagram shown in Fig. 1). The red dashed curve represents the FAST spectrum extracted from a beam-sized aperture centred on the nearby galaxy NGVS 3543.
Current usage metrics show cumulative count of Article Views (full-text article views including HTML views, PDF and ePub downloads, according to the available data) and Abstracts Views on Vision4Press platform.
Data correspond to usage on the plateform after 2015. The current usage metrics is available 48-96 hours after online publication and is updated daily on week days.
Initial download of the metrics may take a while.