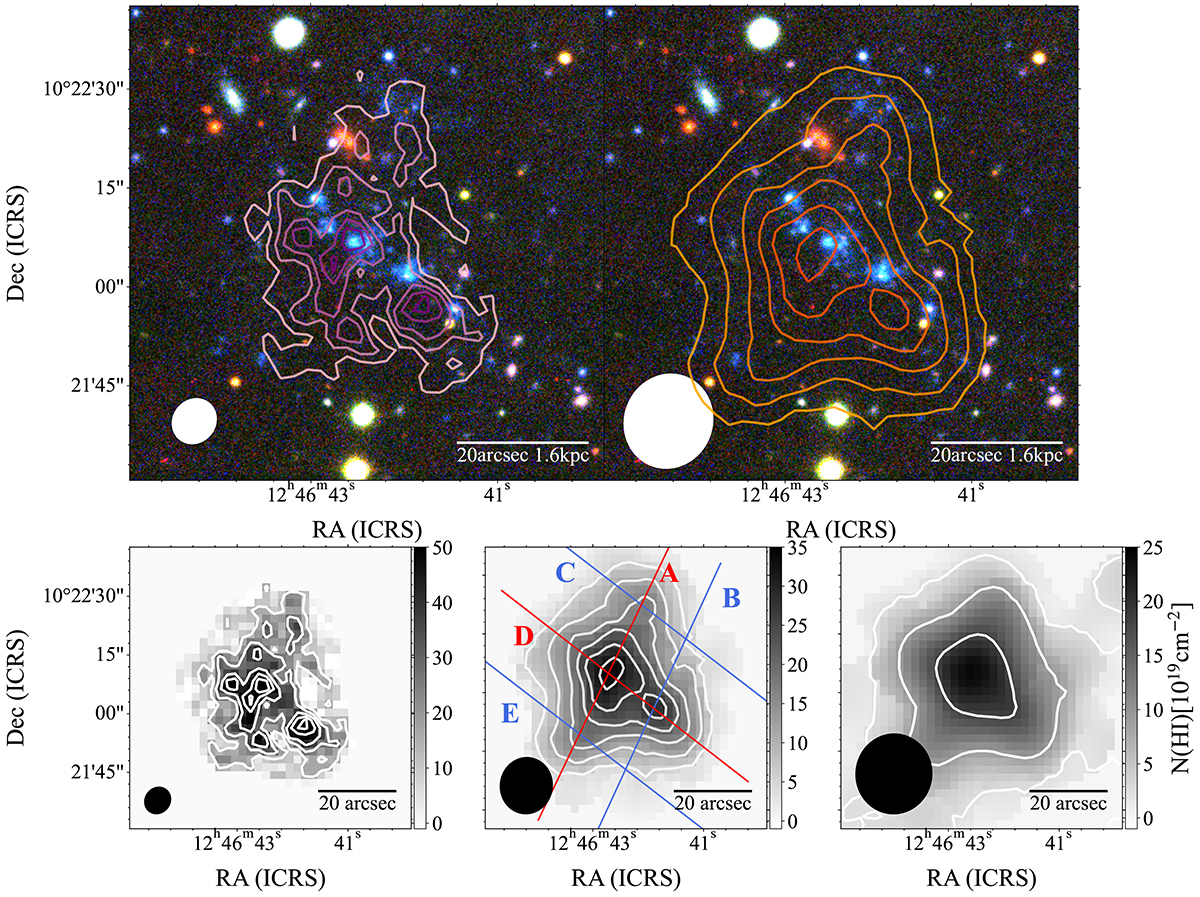
Fig. 5.
Download original image
Integrated H I intensity distribution (moment 0 maps) of AGC 226178. Filled ellipse in the bottom left corner of each panel indicates the synthesized VLA beam of the corresponding data. Upper left: H I intensity contours of the robust-weighted overlaid on the false colour composite image made of NGVS i-, g-, u-band. The contour levels indicate a column density of (1.3, 2.6, 3.9, 5.2, 6.4) × 1020 cm−2. The scale bar at the bottom right corner is for a distance of 16.5 Mpc. Upper right: similar to the upper left panel, but for the natural-weighted H I map. The contours are for column density of (0.5, 1.1, 1.6, 2.1, 2.7, 3.2) × 1020 cm−2. Bottom left: Robust-weighted moment 0 map in grey scale with added contours. Contour levels are the same as the top left panel. Bottom middle: Moment 0 map of the natural-weighted map in grey scale and added contours. Contour levels are the same as in the top right panel. The solid lines indicate the slits used to extract the PV diagrams shown in Fig. A.1. Slit D indicates the major axis with the largest velocity gradient, whereas slit A indicates the minor axis that is perpendicular to the major axis and across the central H I peak. Bottom right: Similar to the other bottom panels, but for the uv-tapered map. The contours correspond to column density of (0.2, 0.9, 1.8) × 1020 cm−2.
Current usage metrics show cumulative count of Article Views (full-text article views including HTML views, PDF and ePub downloads, according to the available data) and Abstracts Views on Vision4Press platform.
Data correspond to usage on the plateform after 2015. The current usage metrics is available 48-96 hours after online publication and is updated daily on week days.
Initial download of the metrics may take a while.