Fig. 7.
Download original image
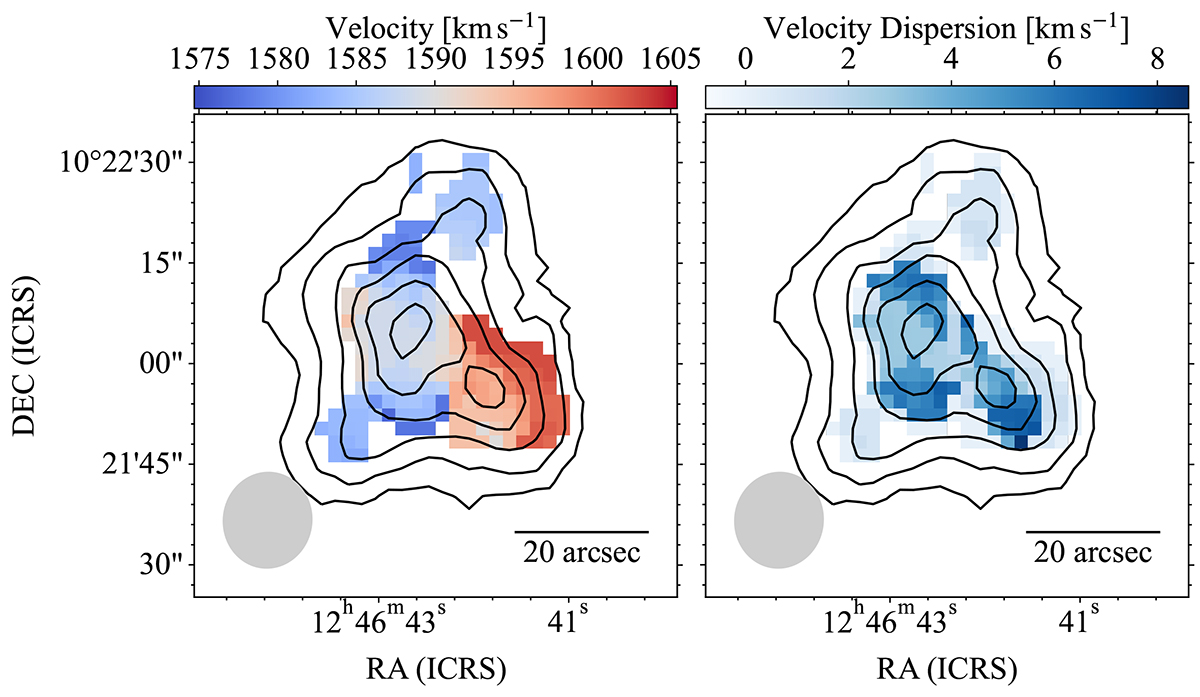
Left: Intensity-weighted velocity field (moment 1 map) of the natural weighted VLA data overlaid with the moment 0 map contours shown in Fig. 5; Right: Intensity-weighted velocity dispersion map (moment 2 map) of the same VLA data overlaid with moment 0 contours. The synthesized beam is indicated in the bottom left corner of each panel.
Current usage metrics show cumulative count of Article Views (full-text article views including HTML views, PDF and ePub downloads, according to the available data) and Abstracts Views on Vision4Press platform.
Data correspond to usage on the plateform after 2015. The current usage metrics is available 48-96 hours after online publication and is updated daily on week days.
Initial download of the metrics may take a while.