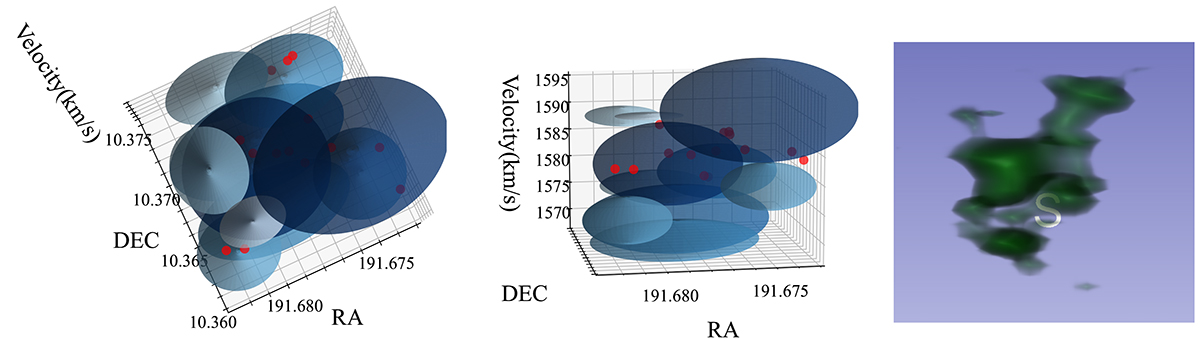
Fig. 9.
Download original image
Left and middle: 3D illustration of H I clumps detected with CUPID, with different viewing angles for the left and middle panels. Blue ellipsoids represent the H I clumps, and red dots indicate the Hα emission regions detected in MUSE data. The size of the ellipsoids indicates the spatial size and velocity width of each clump, colour-coded by the H I flux. Right: 3D illustration of the natural-weighed VLA data produced by the 3D-Slicer package, with a fixed threshold cut applied and the same viewing angle as the middle panel.
Current usage metrics show cumulative count of Article Views (full-text article views including HTML views, PDF and ePub downloads, according to the available data) and Abstracts Views on Vision4Press platform.
Data correspond to usage on the plateform after 2015. The current usage metrics is available 48-96 hours after online publication and is updated daily on week days.
Initial download of the metrics may take a while.