Open Access
Fig. 10
Download original image
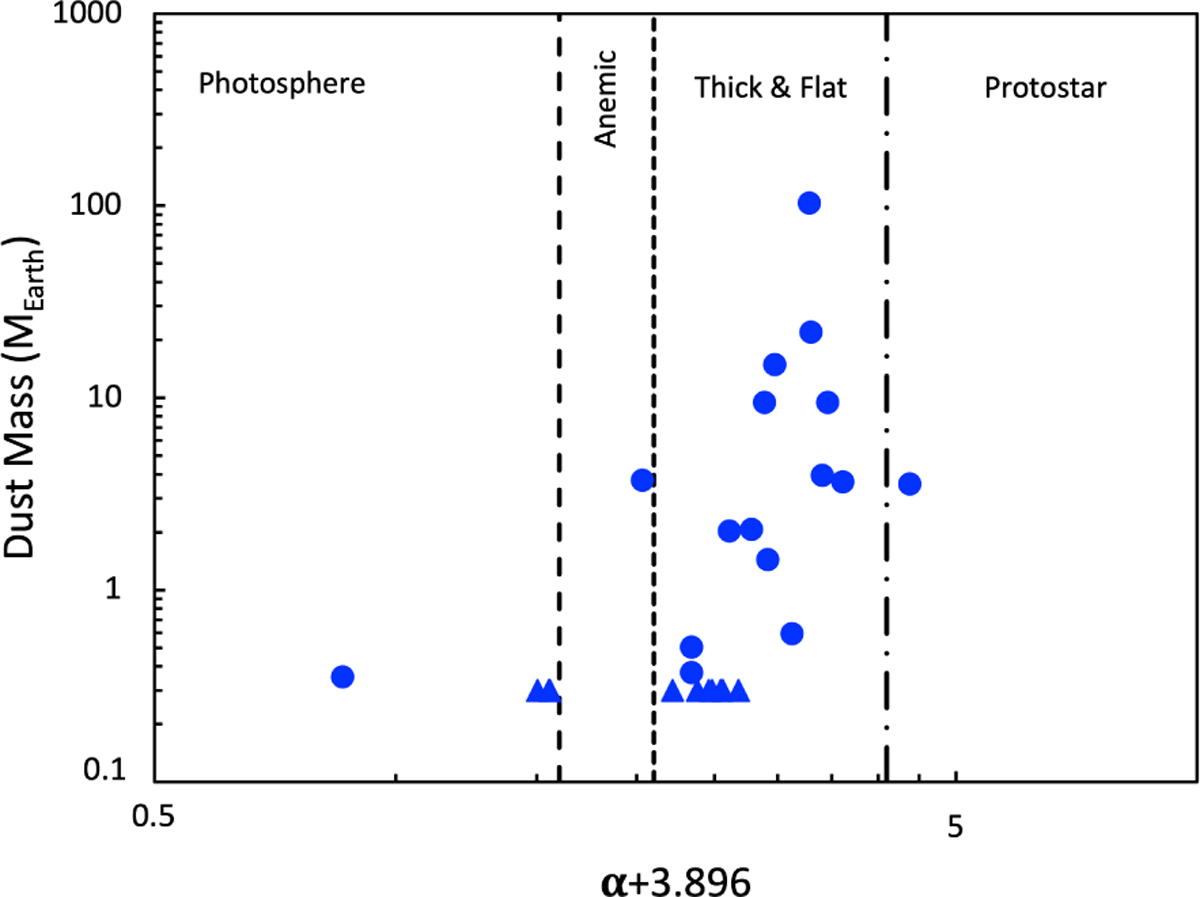
Correlation between the α′ value and the dust mass in the disks observed with ALMA by Cazzoletti et al. (2019). Blues circles are actual measures with ALMA, triangles are upper limits. The dashed lines separate the different categories of disks as labeled in Table 2. Thick disks and flat spectra are merged together.
Current usage metrics show cumulative count of Article Views (full-text article views including HTML views, PDF and ePub downloads, according to the available data) and Abstracts Views on Vision4Press platform.
Data correspond to usage on the plateform after 2015. The current usage metrics is available 48-96 hours after online publication and is updated daily on week days.
Initial download of the metrics may take a while.