Fig. 16
Download original image
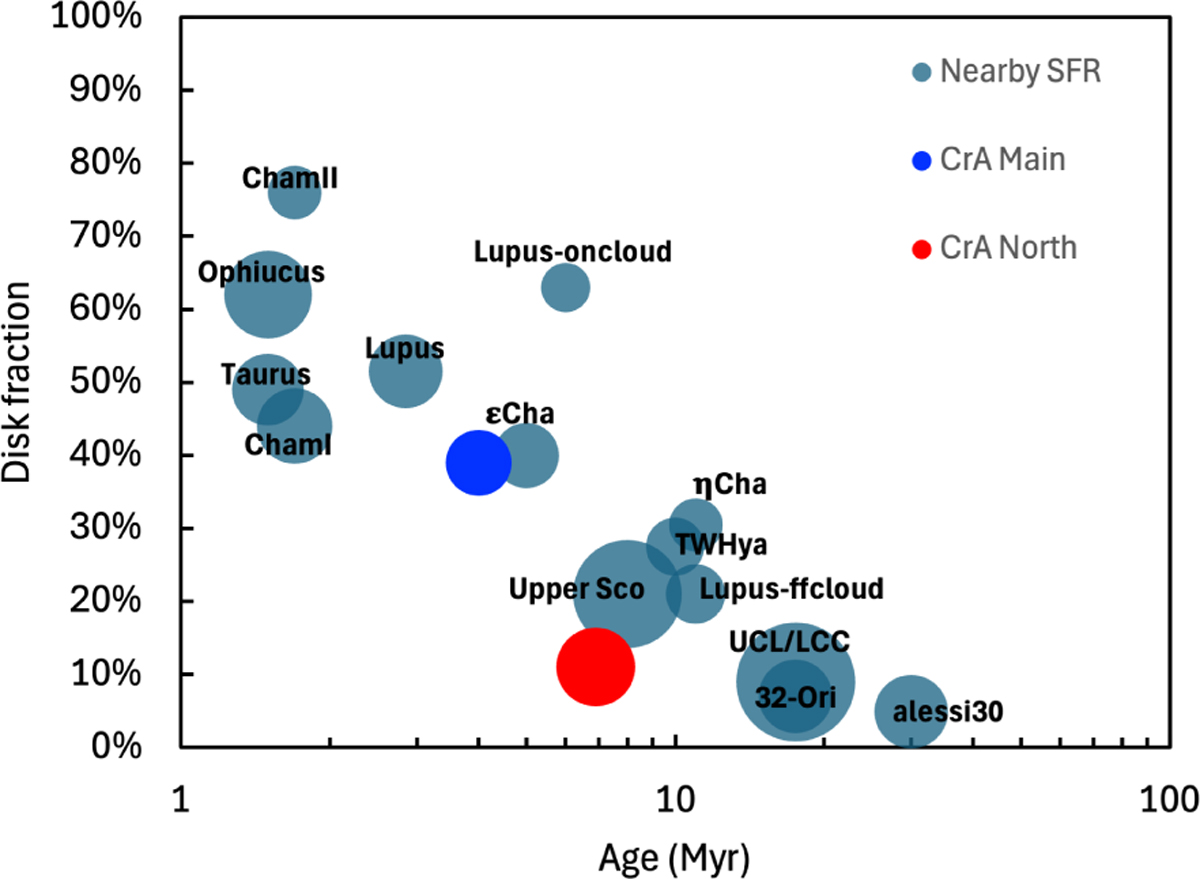
Frequency of disks in nearby star-forming regions and young associations (as labeled) as a function of age. Gray symbols are from Pfalzner & Dincer (2024); the blue and red symbols are those we found for CrA-Main and CrA-North. The diameter of the symbols is proportional to the logarithm of the number of stars in each association.
Current usage metrics show cumulative count of Article Views (full-text article views including HTML views, PDF and ePub downloads, according to the available data) and Abstracts Views on Vision4Press platform.
Data correspond to usage on the plateform after 2015. The current usage metrics is available 48-96 hours after online publication and is updated daily on week days.
Initial download of the metrics may take a while.