Fig. 4.
Download original image
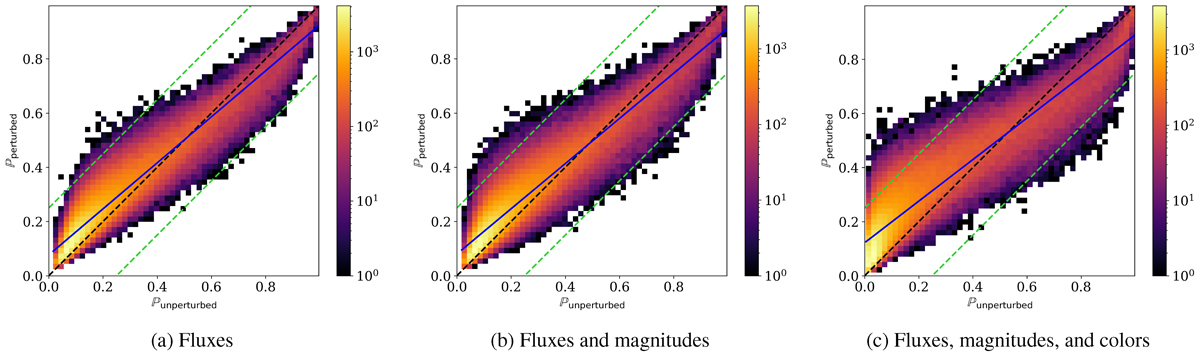
Comparison of the perturbations in the prediction data results for fluxes (a), fluxes and magnitudes (b), and fluxes, magnitudes, and colors (c). The blue lines in each subplot represent a fit to the data, the dashed black lines show the 1:1 relation, and the dashed green lines show the 0.25 score deviation from the black line.
Current usage metrics show cumulative count of Article Views (full-text article views including HTML views, PDF and ePub downloads, according to the available data) and Abstracts Views on Vision4Press platform.
Data correspond to usage on the plateform after 2015. The current usage metrics is available 48-96 hours after online publication and is updated daily on week days.
Initial download of the metrics may take a while.