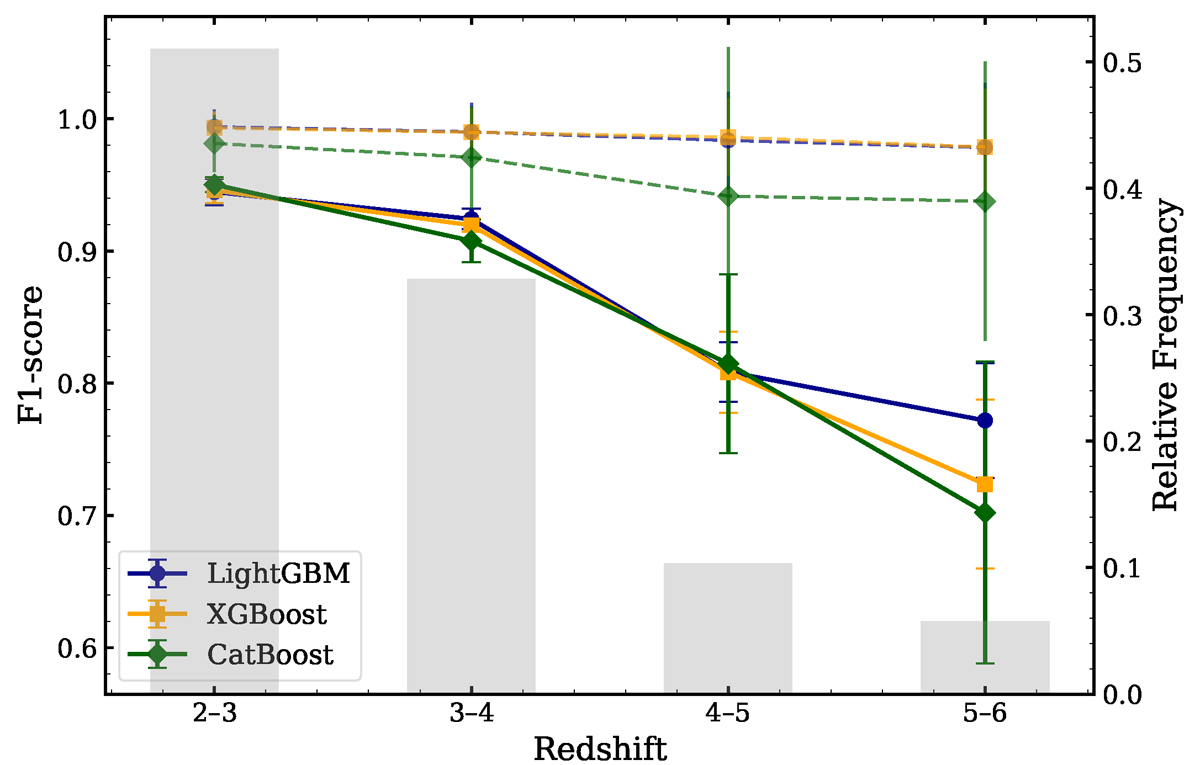
Fig. 5.
Download original image
Variation in the test and train (dashed) F1-scores as a function of redshift for the three gradient-boosting models LightGBM, XGBoost, and CatBoost. The overlaid histogram represents the normalized relative frequency of sources within each redshift bin in the training/testing samples. This combined view illustrates the relation between the model performance and data availability.
Current usage metrics show cumulative count of Article Views (full-text article views including HTML views, PDF and ePub downloads, according to the available data) and Abstracts Views on Vision4Press platform.
Data correspond to usage on the plateform after 2015. The current usage metrics is available 48-96 hours after online publication and is updated daily on week days.
Initial download of the metrics may take a while.