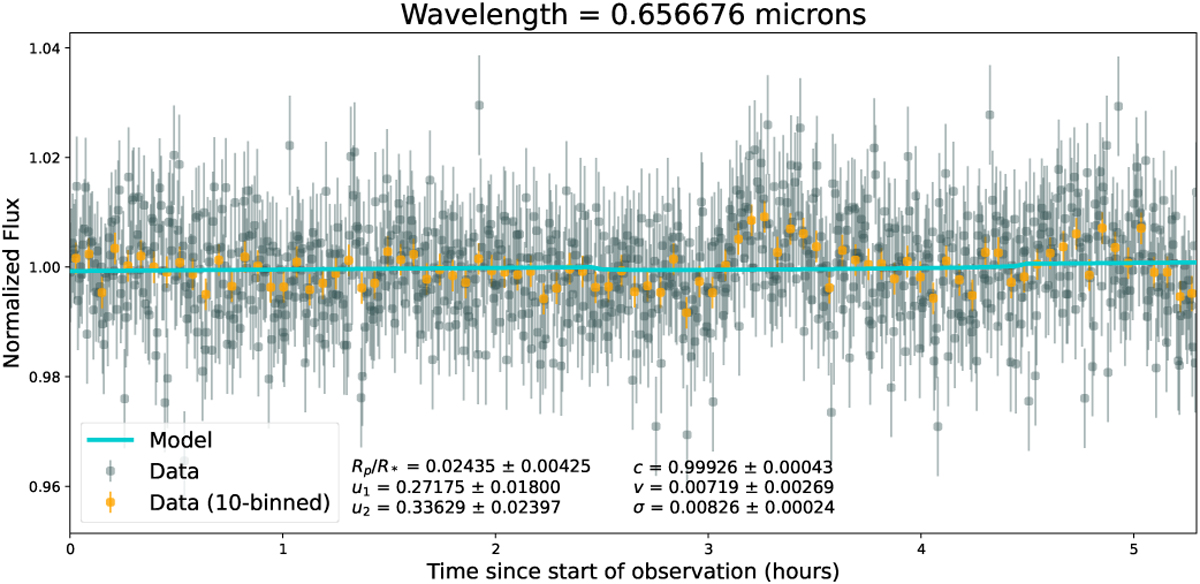
Fig. B.1
Download original image
Attempted light curve fit of the wavelength bin covering the Hα spectral line at 656.46 nm. The fit is unsuccessful due to a increase in the stellar flux of ≈ 1% right in the center of the transit, leading to convergence of the transit depth to the lower prior boundary. Similar patterns starting at the 3 hour mark can be found all across the second order data, but none are as extreme as this one.
Current usage metrics show cumulative count of Article Views (full-text article views including HTML views, PDF and ePub downloads, according to the available data) and Abstracts Views on Vision4Press platform.
Data correspond to usage on the plateform after 2015. The current usage metrics is available 48-96 hours after online publication and is updated daily on week days.
Initial download of the metrics may take a while.