Open Access
Fig. C.1
Download original image
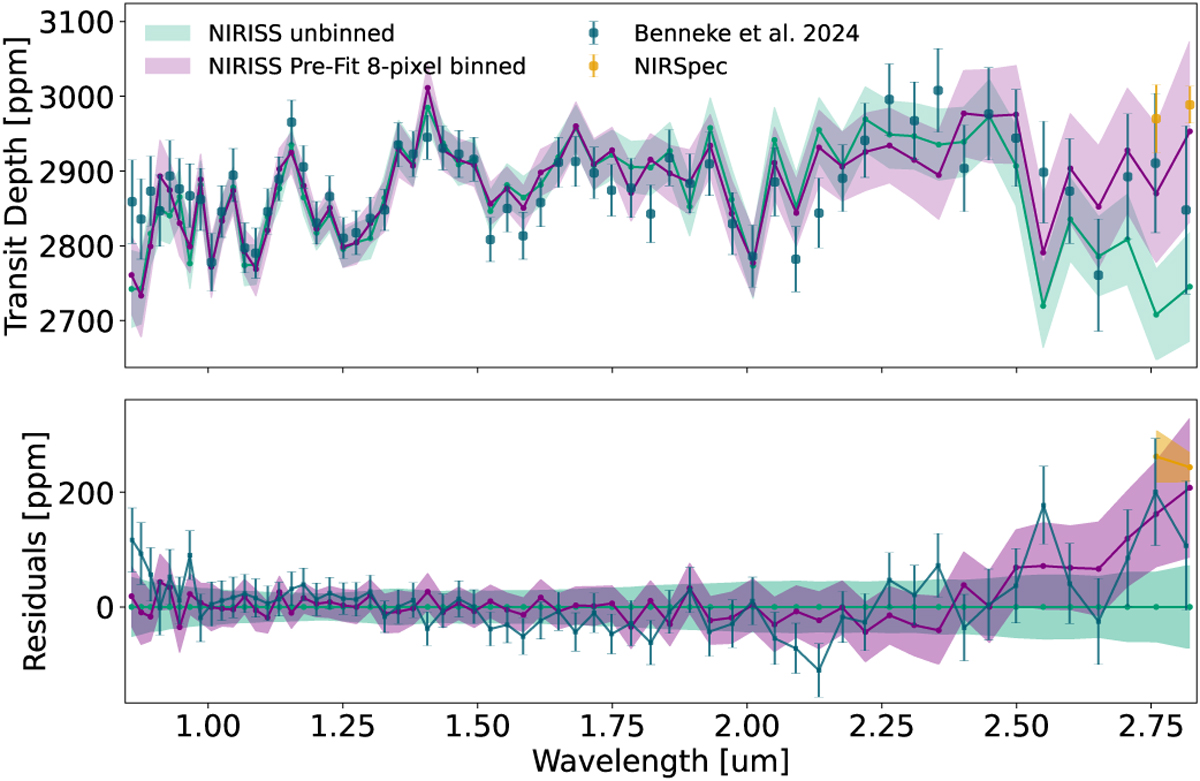
NIRISS spectra based on two different choices for data binning. The top panel shows the resulting transit depths and compares them to the work by Benneke et al. (2024). Bottom panel depicts the corresponding residuals.
Current usage metrics show cumulative count of Article Views (full-text article views including HTML views, PDF and ePub downloads, according to the available data) and Abstracts Views on Vision4Press platform.
Data correspond to usage on the plateform after 2015. The current usage metrics is available 48-96 hours after online publication and is updated daily on week days.
Initial download of the metrics may take a while.