Fig. 6
Download original image
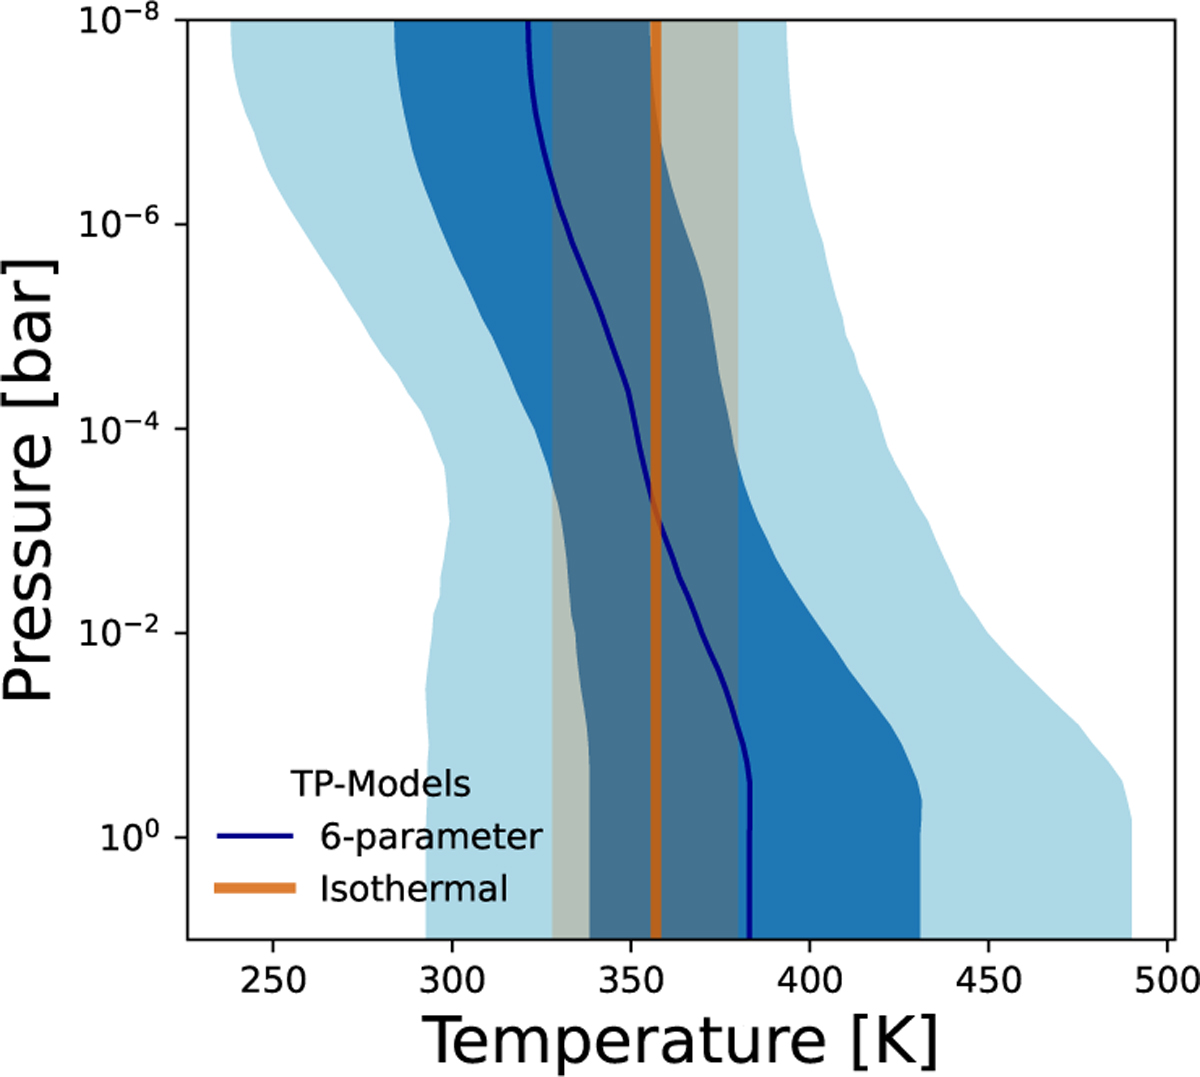
Comparison of the two retrieved temperature-pressure profile models: the fiducial isothermal model and the more complex six-parameter model used in Holmberg & Madhusudhan (2024). The blue-shaded areas refer to the 1σ and 2σ intervals, while the black, solid line represents the median temperature profile of the posterior sample. The red temperature profile corresponds to the median temperature and 1σ interval of our fiducial model.
Current usage metrics show cumulative count of Article Views (full-text article views including HTML views, PDF and ePub downloads, according to the available data) and Abstracts Views on Vision4Press platform.
Data correspond to usage on the plateform after 2015. The current usage metrics is available 48-96 hours after online publication and is updated daily on week days.
Initial download of the metrics may take a while.