Fig. 8
Download original image
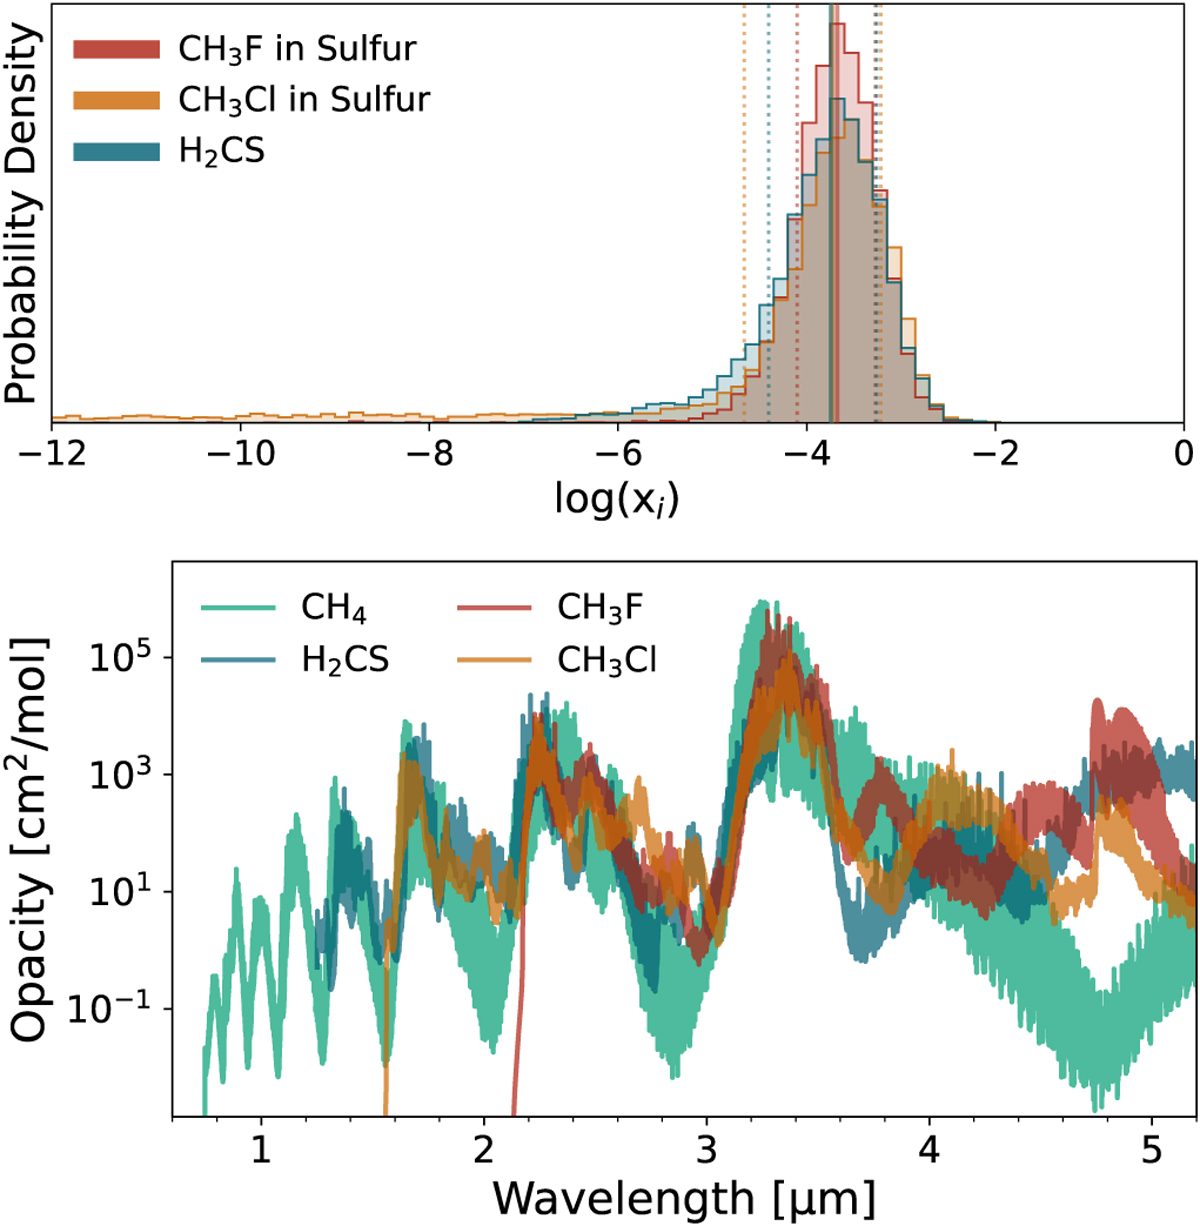
Degeneracy of CH3Cl, CH3F, and H2CS as potential model extensions. Top: normalized posterior distributions for each molecule in the sulfur-species models. The posteriors are taken from the models listed in the last three columns of Table 3. The solid lines represent the median value, while the dashed lines describe the corresponding 1σ intervals. Bottom: comparison of absorption cross-sections as a function of wavelength at a temperature of 400 K and a pressure of 1 bar over the wavelength-range of the JWST observations used in this study.
Current usage metrics show cumulative count of Article Views (full-text article views including HTML views, PDF and ePub downloads, according to the available data) and Abstracts Views on Vision4Press platform.
Data correspond to usage on the plateform after 2015. The current usage metrics is available 48-96 hours after online publication and is updated daily on week days.
Initial download of the metrics may take a while.