Open Access
Fig. D.1
Download original image
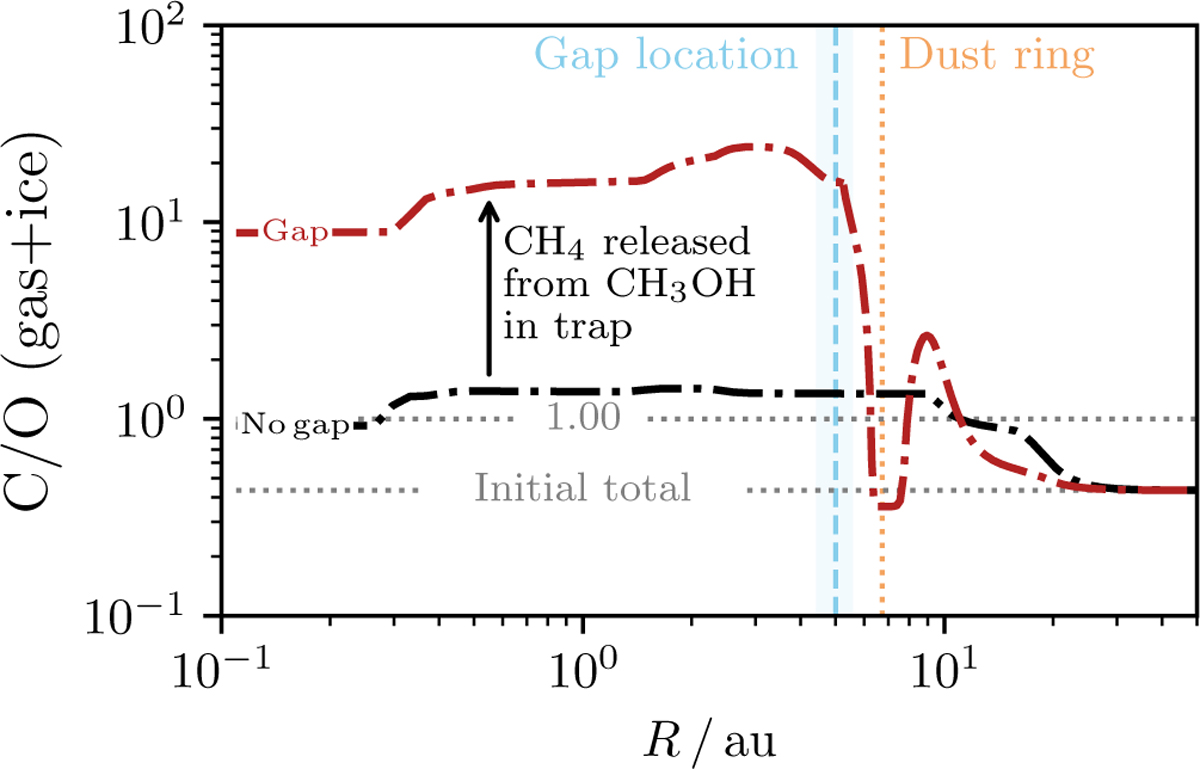
C/O as a function of R at 2.5 Myr for models with no trap (black) or a warm trap (red) in a 50 au disc around a 0.1 M⊙ star with an ionisation rate of 1.3 × 10⁻¹⁷ s−1. Vertical lines mark the location of the minimum gas density (’Gap location’) and the pressure maximum where dust accumulates (’Dust ring’).
Current usage metrics show cumulative count of Article Views (full-text article views including HTML views, PDF and ePub downloads, according to the available data) and Abstracts Views on Vision4Press platform.
Data correspond to usage on the plateform after 2015. The current usage metrics is available 48-96 hours after online publication and is updated daily on week days.
Initial download of the metrics may take a while.