Fig. 2
Download original image
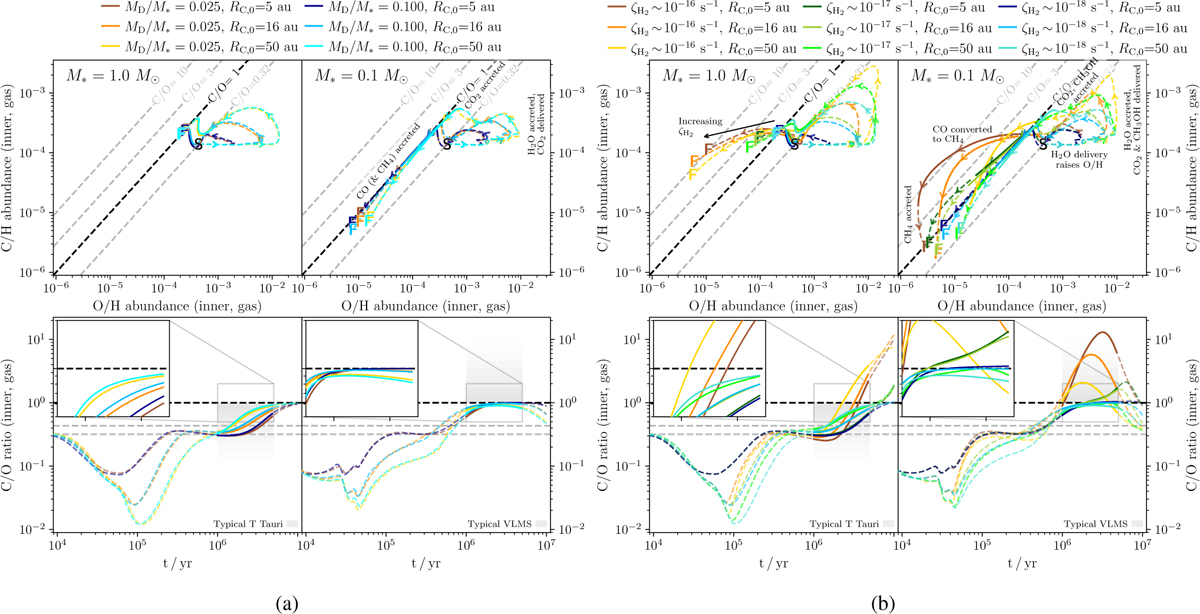
Evolution of different disc models for 10 Myr. a) Models that do not include reactions of C-bearing species for various initial disc-to-star mass ratios and initial disc sizes. b) Models that include reactions of CO. All models have a fixed initial disc-to-star mass ratio of 0.05 but different combinations of ionisation rate and disc size. In each panel, the tracks start at ‘S’ and evolve in the direction of the arrows, ending at ‘F’. The solid sections represent ages of 1–5 Myr appropriate for most discs studied so far with MIRI-MRS. In each block, the left-hand columns show models around a 1.0 M⊙ star, representative of TTSs, while the right-hand columns show models around a 0.1 M⊙ star, representative of VLMS. The top rows plot the discs in the plane of the inner-disc gas-phase C/H vs gas-phase O/H. Dashed lines indicate where C/O=0.32,1,3,10. The bottom rows plot the gas-phase C/O in the inner disc over time. The horizontal dashed lines show ratios of 0.32 (initial ratio of volatile abundances), 0.43 (ratio of total abundances) and 1 and the lightly shaded regions indicate the typically observed range of C/O at 1–5 Myr for each stellar mass regime.
Current usage metrics show cumulative count of Article Views (full-text article views including HTML views, PDF and ePub downloads, according to the available data) and Abstracts Views on Vision4Press platform.
Data correspond to usage on the plateform after 2015. The current usage metrics is available 48-96 hours after online publication and is updated daily on week days.
Initial download of the metrics may take a while.