Fig. 5
Download original image
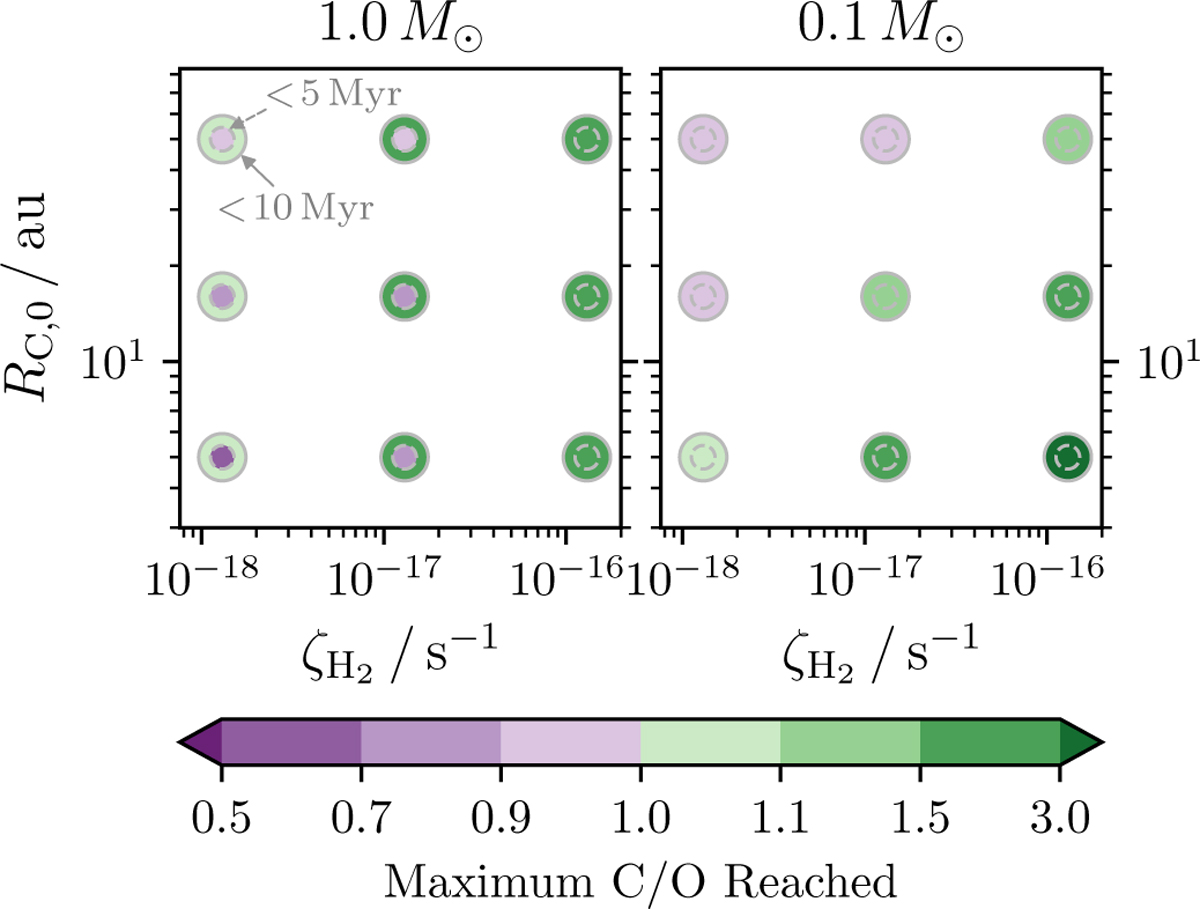
Maximum inner-disc gas-phase C/O achieved for different parameters in smooth disc models with hydrocarbon formation around 1.0 M⊙ TTSs (left) or 0.1 M⊙ VLMSs (right). Darker green colours indicate more C-rich discs, while darker purple colours indicate more O-rich discs. We note that the colour bar is neither linear nor symmetric. The central circles show the maxima within the first 5 Myr, while the outer rings show the maxima across the full 10 Myr model run.
Current usage metrics show cumulative count of Article Views (full-text article views including HTML views, PDF and ePub downloads, according to the available data) and Abstracts Views on Vision4Press platform.
Data correspond to usage on the plateform after 2015. The current usage metrics is available 48-96 hours after online publication and is updated daily on week days.
Initial download of the metrics may take a while.