Fig. A.1
Download original image
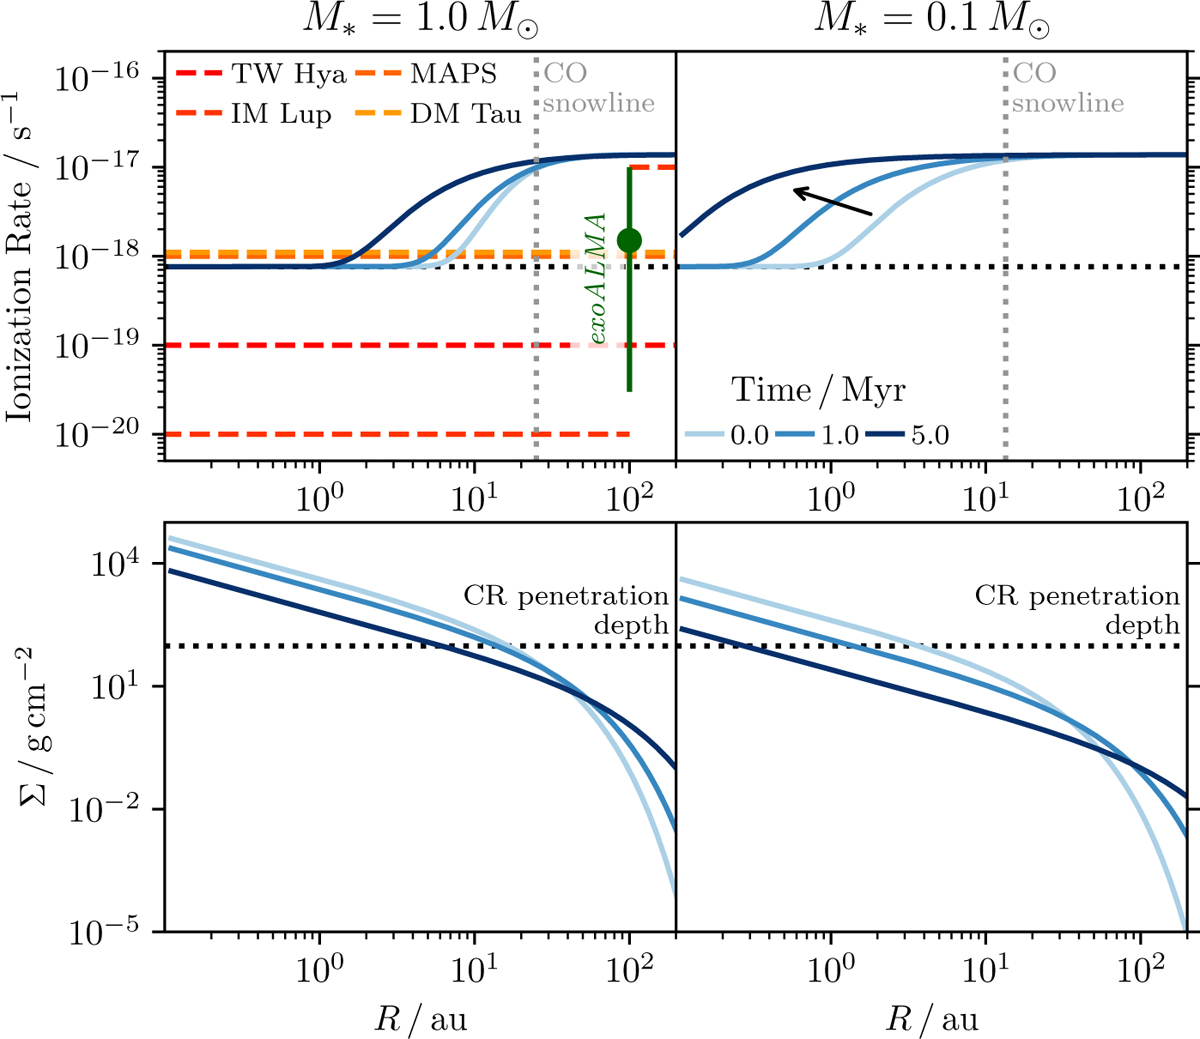
Top: Midplane ionisation rate profile at t=0, 1, and 5 Myr (increasingly dark blues, evolution indicated by arrow) for fiducial models around TTS (left) and VLMSs (right). The TTS models are compared to observationally estimated values for individual sources (red and yellow colours) and the range and median for the exoALMA program (Trapman et al. 2025). The black horizontal line on each plot represents the floor due to SLRs and the vertical dotted line shows the location of the CO snowline. Bottom: Surface densities of the gas at the times indicated in the top panels. The horizontal line shows the assumed 96 g cm−2 penetration depth of CRs.
Current usage metrics show cumulative count of Article Views (full-text article views including HTML views, PDF and ePub downloads, according to the available data) and Abstracts Views on Vision4Press platform.
Data correspond to usage on the plateform after 2015. The current usage metrics is available 48-96 hours after online publication and is updated daily on week days.
Initial download of the metrics may take a while.