Open Access
Fig. 4.
Download original image
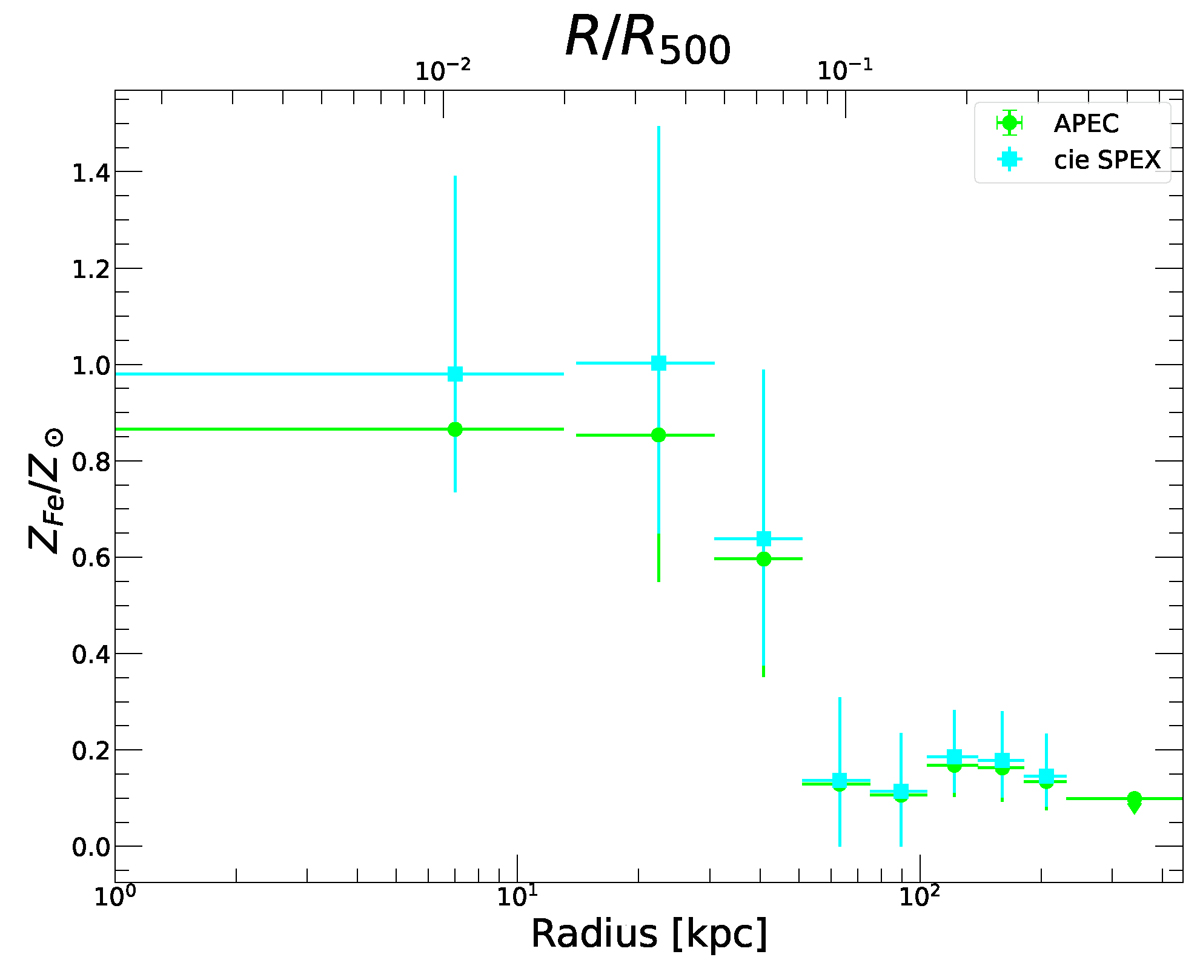
Metal abundance profile of S4436 as a fraction of the solar value. The data points show the results of single-temperature fits to the XMM-Newton spectra with the APEC (green circles) and SPEX (cyan squares) plasma emission codes. The outermost point is an upper limit to the single-temperature metallicity.
Current usage metrics show cumulative count of Article Views (full-text article views including HTML views, PDF and ePub downloads, according to the available data) and Abstracts Views on Vision4Press platform.
Data correspond to usage on the plateform after 2015. The current usage metrics is available 48-96 hours after online publication and is updated daily on week days.
Initial download of the metrics may take a while.