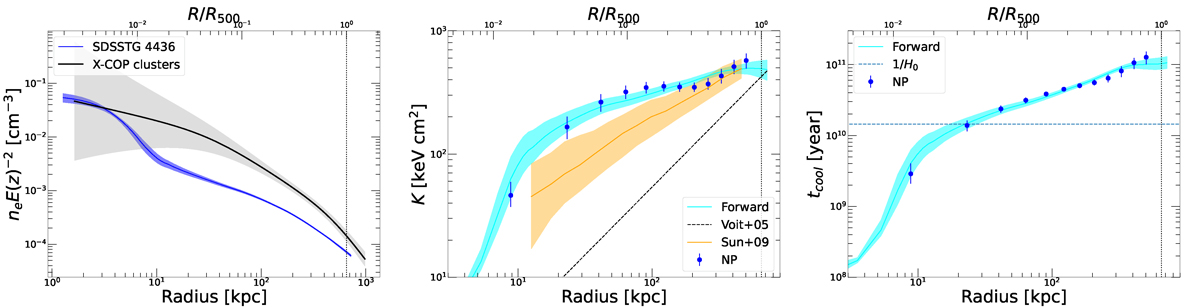
Fig. 5.
Download original image
Three-dimensional thermodynamic profiles of the IGrM of S4436. The left-hand panel shows the electron density profile (blue curve). For comparison, the black curve and shaded area show the mean and scatter of the gas density profiles in a sample of massive galaxy clusters (Ghirardini et al. 2019). The middle panel shows the gas entropy obtained using the parametric (cyan curve) and non-parametric (blue points) deprojection techniques, compared with the entropy profile expected from gravitational collapse (Voit et al. 2005) (dashed curve) and with the entropy profiles of galaxy groups in the same mass range (Sun et al. 2009) (orange curve and shaded area). The right-hand panel shows the reconstruction of the gas cooling time, with the approximate age of the Universe, 1/H0, indicated by the horizontal dashed line. In all three panels, the vertical dashed line shows the location of R500 = 648 kpc.
Current usage metrics show cumulative count of Article Views (full-text article views including HTML views, PDF and ePub downloads, according to the available data) and Abstracts Views on Vision4Press platform.
Data correspond to usage on the plateform after 2015. The current usage metrics is available 48-96 hours after online publication and is updated daily on week days.
Initial download of the metrics may take a while.