Fig. 8.
Download original image
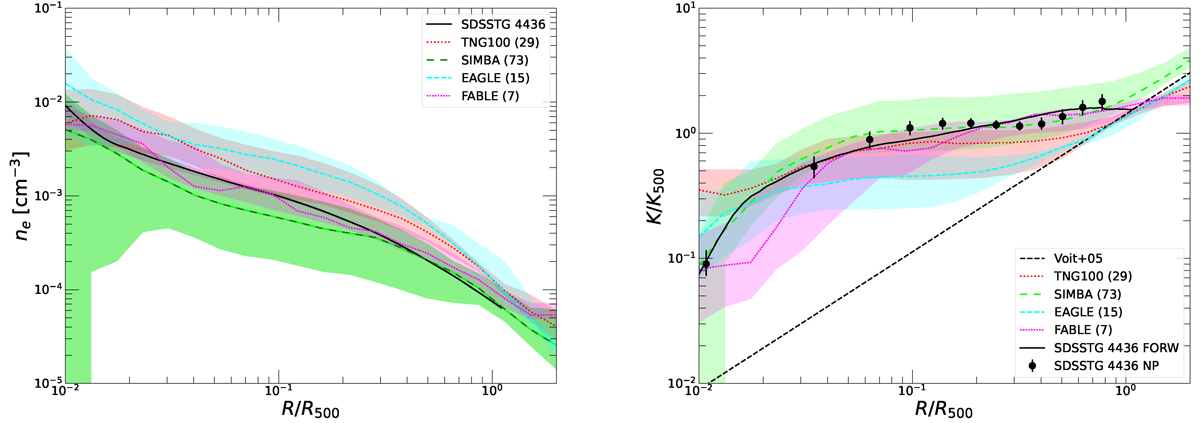
Median and dispersion of gas thermodynamic profiles in four different simulations with various AGN feedback implementations. Left: Electron number density profiles for galaxy groups in the TNG100 (dotted red), SIMBA (long dashed green), EAGLE (short dashed cyan), and FABLE (dashed magenta) simulations. In each case, the curve shows the median of the population, whereas the shaded area shows the 1-σ scatter around the median. The density profile of S4436 is indicated as the black curve. The numbers in parenthesis show the number of selected halos from each simulation set. Right: Same as the left-hand panel for the self-similar scaled gas entropy.
Current usage metrics show cumulative count of Article Views (full-text article views including HTML views, PDF and ePub downloads, according to the available data) and Abstracts Views on Vision4Press platform.
Data correspond to usage on the plateform after 2015. The current usage metrics is available 48-96 hours after online publication and is updated daily on week days.
Initial download of the metrics may take a while.