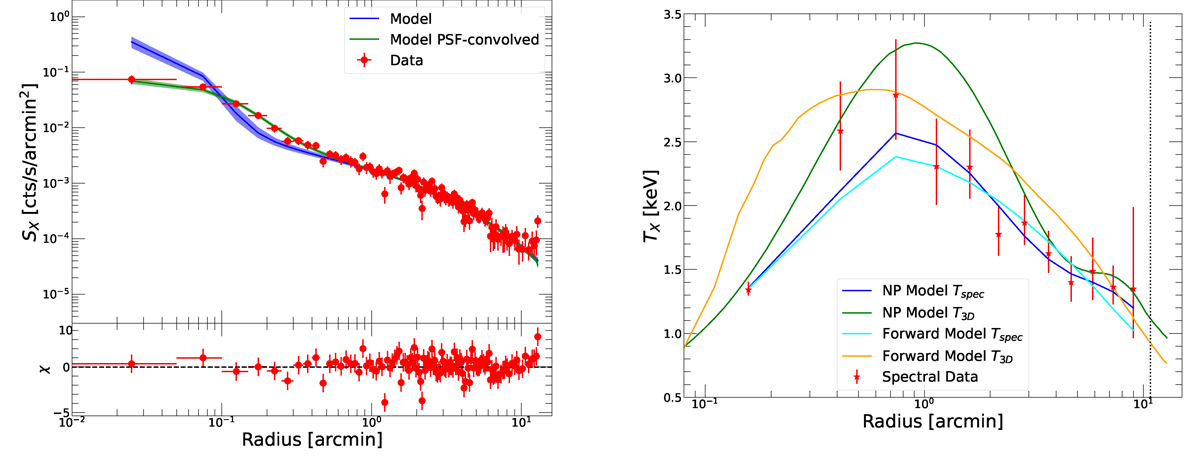
Fig. A.1.
Download original image
Deprojection and PSF deconvolution. Left: Surface brightness profile in the [0.7-1.2] keV band (red points). The green curve shows the best fitting multi-scale model (green curve), projected along the line of sight and convolved with the XMM-Newton PSF. The blue curve shows the model profile deconvolved from the PSF. In the bottom panel we show the residuals from the best fit model. Right: Spectroscopic temperature profile (red points) and best fitting models. The orange and green curves show the 3D model profiles from the ‘Forward’ and ‘non-parametric’ methods, respectively. The blue and cyan curves show the corresponding projected and PSF convolved models.
Current usage metrics show cumulative count of Article Views (full-text article views including HTML views, PDF and ePub downloads, according to the available data) and Abstracts Views on Vision4Press platform.
Data correspond to usage on the plateform after 2015. The current usage metrics is available 48-96 hours after online publication and is updated daily on week days.
Initial download of the metrics may take a while.