Fig. 1
Download original image
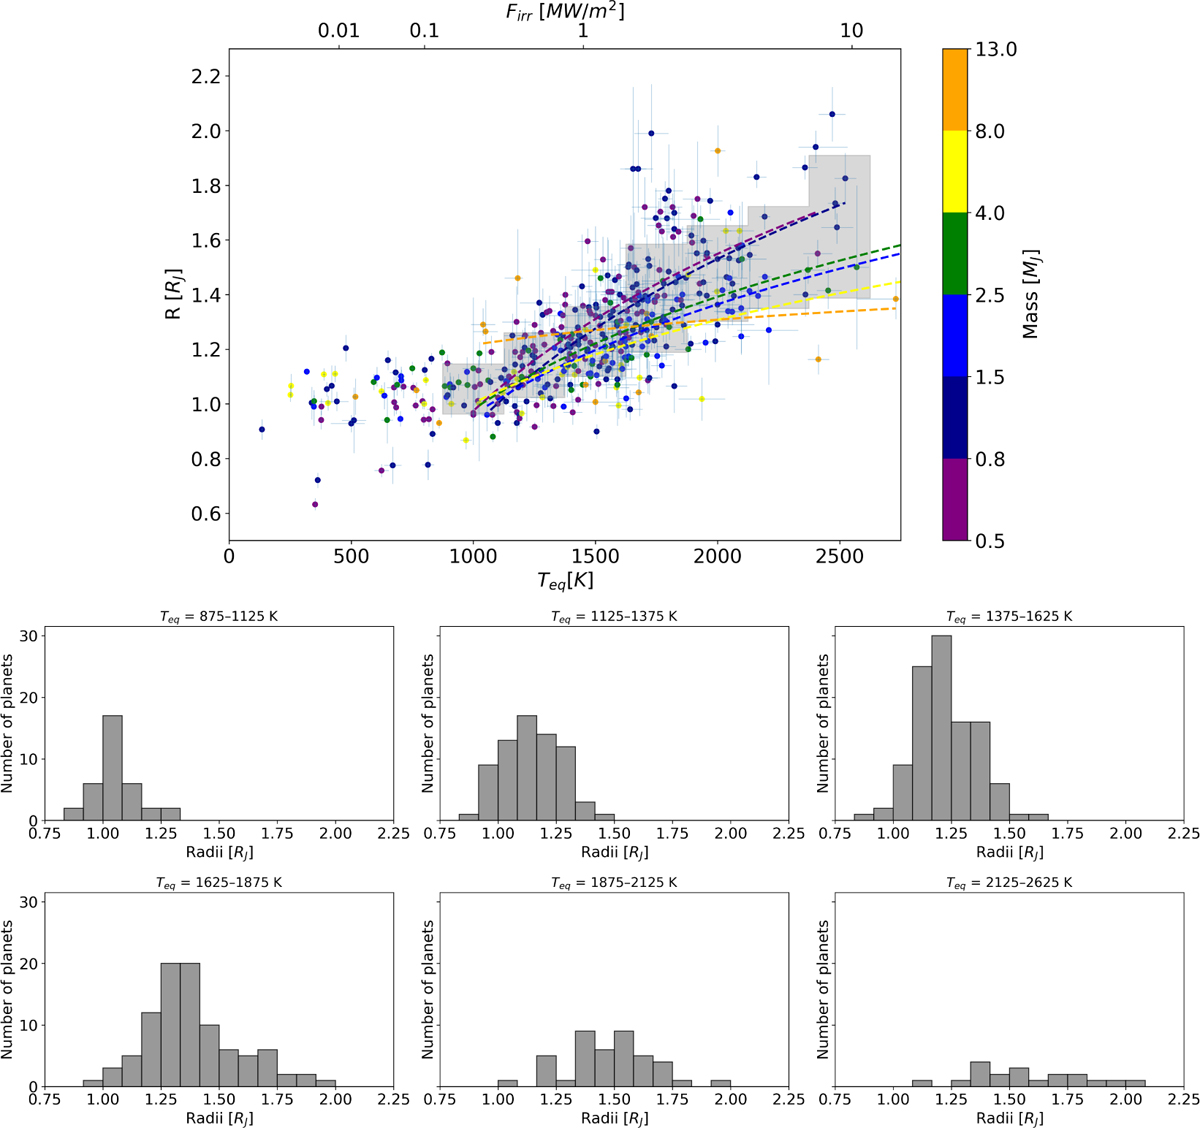
Hot Jupiter inflated radii observational trends for the 424 Jupiter-like exoplanets in the database with available estimated mass M ≥ 0.5 Mj; age t ≥ 100 Myr; radius, R; and equilibrium temperature, Teq. We consider only the planets with relative errors in a radius of less than 25% and available uncertainties for the mass. We also excluded seven planets younger than 100 Myr. Top: [lanetary radius, R, versus, Teq, or, equivalently, irradiated flux ![]() . The colour of the data points identify the mass by ranges as follows: purple [0.5,0.8) Mj, dark blue [0.8,1.5) Mj, blue [1.5,2.5) Mj, green [2.5,4) Mj, yellow [4,8) Mj and orange [8,13] Mj . With the same colour coding, the lines represent the best-fit reported in Table 1, for the planets within each mass range, and considering only Teq > 1000 K. For the sake of better visibility of the bulk of planets, we left out three ultra-HJ with Teq > 3300 K from the plot, but they are considered in the statistical trends. The grey background boxes indicate the mean and standard deviation of the observed radius R ± δR for all HJs within a 250 K-wide range of Teq. Bottom: histograms of the observed radii for the same Teq ranges per each Teq range of the grey boxes of the top panel. Due to the small size of the hottest HJ sample, we grouped two Teq bins in the last histogram.
. The colour of the data points identify the mass by ranges as follows: purple [0.5,0.8) Mj, dark blue [0.8,1.5) Mj, blue [1.5,2.5) Mj, green [2.5,4) Mj, yellow [4,8) Mj and orange [8,13] Mj . With the same colour coding, the lines represent the best-fit reported in Table 1, for the planets within each mass range, and considering only Teq > 1000 K. For the sake of better visibility of the bulk of planets, we left out three ultra-HJ with Teq > 3300 K from the plot, but they are considered in the statistical trends. The grey background boxes indicate the mean and standard deviation of the observed radius R ± δR for all HJs within a 250 K-wide range of Teq. Bottom: histograms of the observed radii for the same Teq ranges per each Teq range of the grey boxes of the top panel. Due to the small size of the hottest HJ sample, we grouped two Teq bins in the last histogram.
Current usage metrics show cumulative count of Article Views (full-text article views including HTML views, PDF and ePub downloads, according to the available data) and Abstracts Views on Vision4Press platform.
Data correspond to usage on the plateform after 2015. The current usage metrics is available 48-96 hours after online publication and is updated daily on week days.
Initial download of the metrics may take a while.