Fig. 4
Download original image
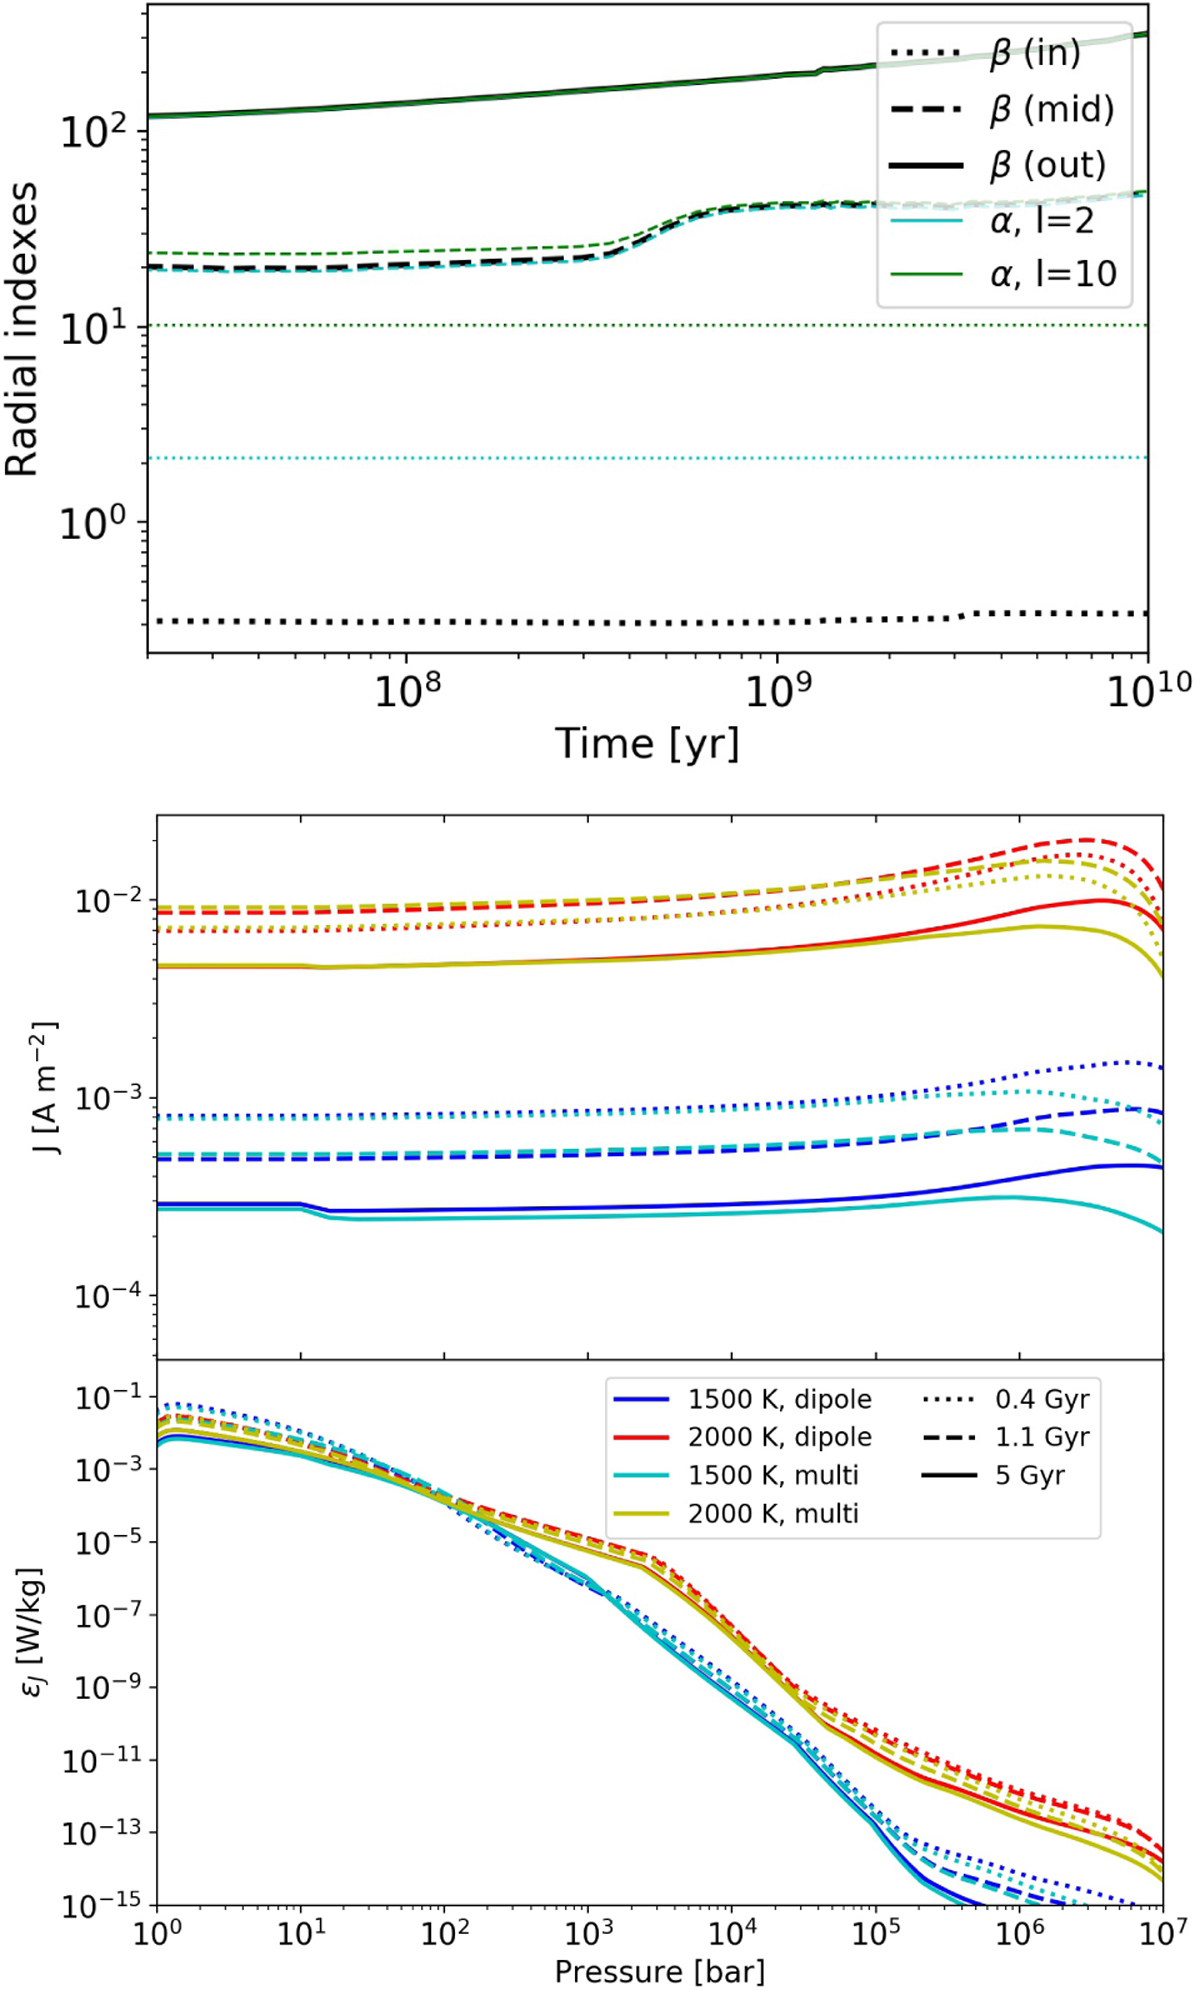
Current reconstruction for the two models with heating considered in Fig. 2. Top: evolution of the best-fitting power-law indexes, β (black, indicating the steepness of the conductivity profile σ(r) ∼ r−β), at shallow (p ∼ 102 bar, solid), intermediate (p ∼ 104 bar, dashed), and deep (p ∼ 106–107 bar, dots) layers and the corresponding local indexes, α, of the induced current profile, Eq. (14), for l = 2 (cyan) and l = 10 (green). Middle: radial profiles of the induced currents for the same model at ages of t ≃ 0.4 (dots), 1.1 (dashes), and 5 Gyr (solid lines) for a purely dipolar case, (only j2, 0, blue and red) or multipolar, with a flat magnetic spectrum at dynamo surface from l = 2 to l = 10 (cyan and golden). Bottom: corresponding Ohmic heating rate profiles.
Current usage metrics show cumulative count of Article Views (full-text article views including HTML views, PDF and ePub downloads, according to the available data) and Abstracts Views on Vision4Press platform.
Data correspond to usage on the plateform after 2015. The current usage metrics is available 48-96 hours after online publication and is updated daily on week days.
Initial download of the metrics may take a while.