Fig. 6
Download original image
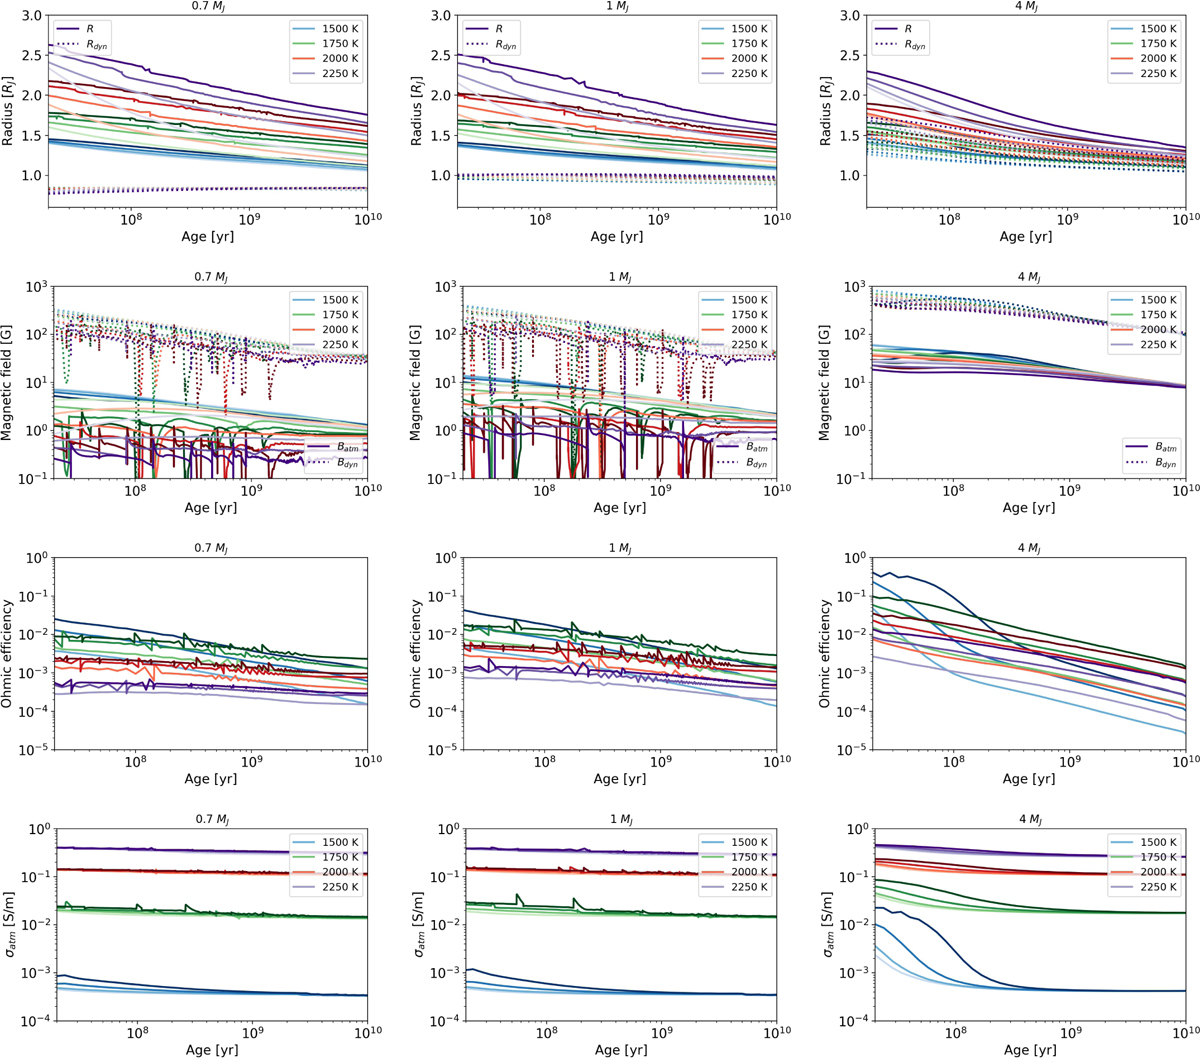
Evolution of radii (top row, with dots indicating the dynamo radius and the solid the planetary radius), estimated magnetic field produced in the dynamo region (second row, with dots for Bdyn and solid lines for the planetary surface, Batm, assuming fdip = 0.1), Ohmic efficiency (third row), and σatm (bottom row). Each column represent a mass, from left to right: M = 0.7,1,4 Mj. In all panels, colours indicate Teq = 1500,1750,2000,2250 K (blue, green, orange, respectively), and four values υavg = {0,1,2,3}/[(M/Mj)(Teq/1500K)6] km/s are indicated by increasingly darker shades. The curves of magnetic fields have been smoothed out by a Savitzky–Golay filter (window length 21, polynomial degree 3) to visually smooth out the frequent oscillations seen in the most heated and irradiated cases in light planets (see text).
Current usage metrics show cumulative count of Article Views (full-text article views including HTML views, PDF and ePub downloads, according to the available data) and Abstracts Views on Vision4Press platform.
Data correspond to usage on the plateform after 2015. The current usage metrics is available 48-96 hours after online publication and is updated daily on week days.
Initial download of the metrics may take a while.