Fig. A.1
Download original image
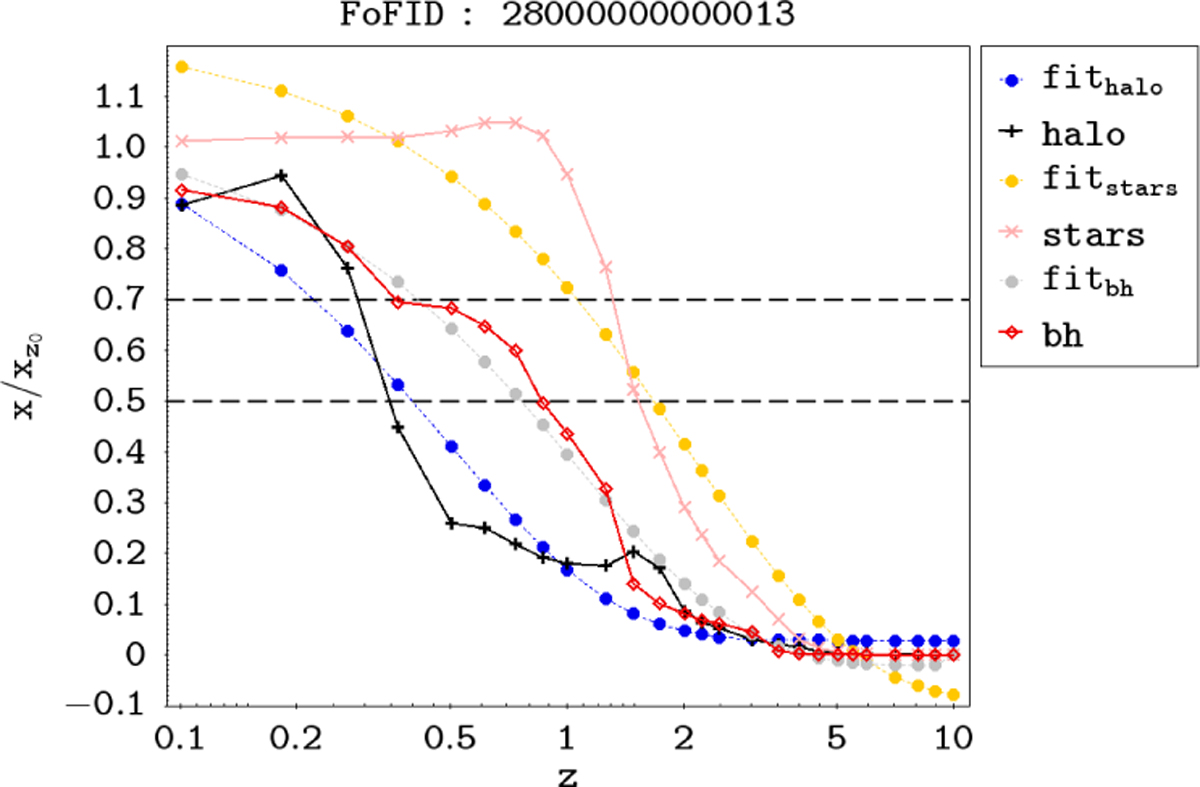
Well-behaved assembly histories for all mass components of the halo identified as FoFID 28000000000013. We plot M200c as a solid black line with crosses, M* as a solid salmon line with “×”-shaped markers, and MBH as a solid red line with small diamonds. The corresponding curve fit functions are shown as dashed lines with coloured dots (blue for M200c, yellow for M*, and light grey for MBH). The horizontal black dashed lines represent t50% and t70%. We observe that these histories display discrete behaviour with some degree of discontinuity. Using methods like curve fitting could result in significantly different estimates for the half-mass assembly time, which we aim to avoid. This example demonstrates that the interpolation approach, without any fit, provides a more accurate result.
Current usage metrics show cumulative count of Article Views (full-text article views including HTML views, PDF and ePub downloads, according to the available data) and Abstracts Views on Vision4Press platform.
Data correspond to usage on the plateform after 2015. The current usage metrics is available 48-96 hours after online publication and is updated daily on week days.
Initial download of the metrics may take a while.