Fig. C.1
Download original image
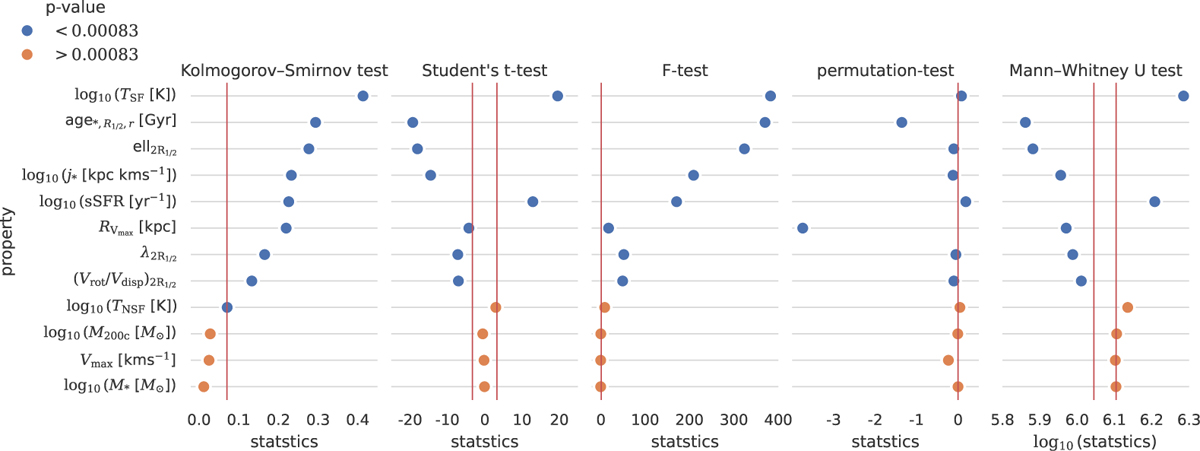
Results of several statistical tests comparing LSB and HSB galaxy samples for selected galaxy and halo properties. Test statistics p < 8.3 × 10⁻⁴ are marked in blue, indicating statistical significance, while those with p > 8.3 × 10⁻⁴ are shown in orange. The vertical red lines denote the critical thresholds for each test beyond which the null hypothesis is rejected.
Current usage metrics show cumulative count of Article Views (full-text article views including HTML views, PDF and ePub downloads, according to the available data) and Abstracts Views on Vision4Press platform.
Data correspond to usage on the plateform after 2015. The current usage metrics is available 48-96 hours after online publication and is updated daily on week days.
Initial download of the metrics may take a while.