Fig. 2
Download original image
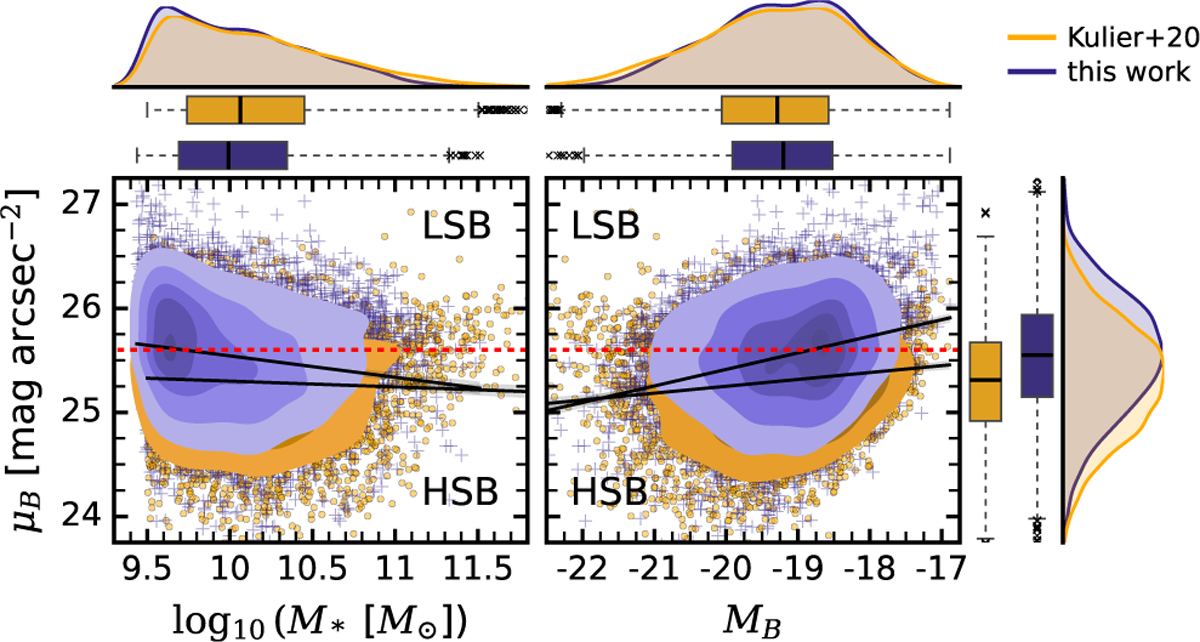
μΒ as a function of M* (left panel) and MB (right panel) at ɀ = 0. We use Eq. (1) to estimate the surface brightness density and corrected optical radii, ![]() , as described in Appendix B. The horizontal red dashed line marks the standard cut-off threshold of μcut = 25.6 mag arcsec−2 to divide the dataset into LSB and HSB populations. We refer to Section 2.2 for statistical definitions.
, as described in Appendix B. The horizontal red dashed line marks the standard cut-off threshold of μcut = 25.6 mag arcsec−2 to divide the dataset into LSB and HSB populations. We refer to Section 2.2 for statistical definitions.
Current usage metrics show cumulative count of Article Views (full-text article views including HTML views, PDF and ePub downloads, according to the available data) and Abstracts Views on Vision4Press platform.
Data correspond to usage on the plateform after 2015. The current usage metrics is available 48-96 hours after online publication and is updated daily on week days.
Initial download of the metrics may take a while.