Open Access
Fig. 4
Download original image
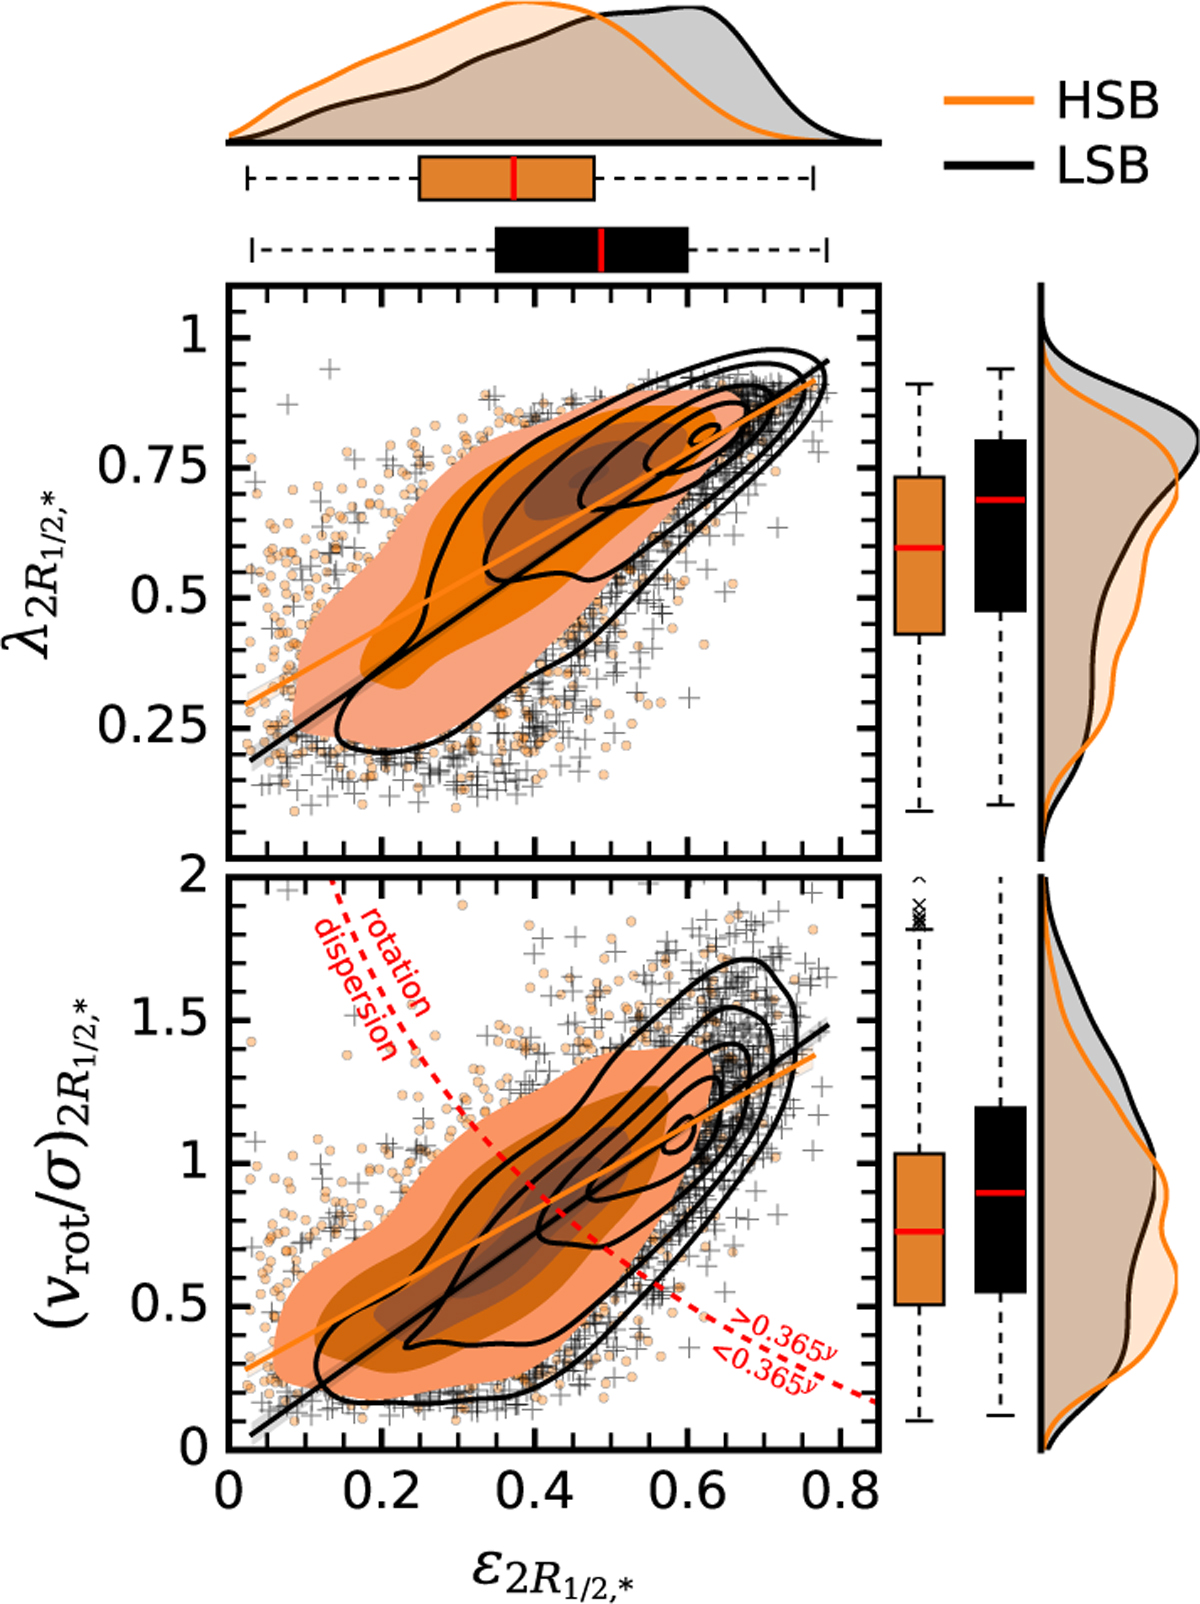
![]() on the top and
on the top and ![]() on the bottom as a function of
on the bottom as a function of ![]() at ɀ = 0. See Fig. 1 for the colour and symbol coding, and refer to Section 2.2 for statistical definitions. The red dashed line represents the empirical boundary separating the rotation-supported sub-population from the dispersion-supported one.
at ɀ = 0. See Fig. 1 for the colour and symbol coding, and refer to Section 2.2 for statistical definitions. The red dashed line represents the empirical boundary separating the rotation-supported sub-population from the dispersion-supported one.
Current usage metrics show cumulative count of Article Views (full-text article views including HTML views, PDF and ePub downloads, according to the available data) and Abstracts Views on Vision4Press platform.
Data correspond to usage on the plateform after 2015. The current usage metrics is available 48-96 hours after online publication and is updated daily on week days.
Initial download of the metrics may take a while.